S&P 500 Stock Market Gamma Trading Levels Based on Options Open Interest

Equity Hub
Key Levels For 3,500+ Stocks & Indices
Evaluate stock entry points based on SpotGamma key levels and options analysis.
AS SEEN IN:
WHAT PEOPLE ARE SAYING
"My realized losses vs. expected losses are better by half in the last two months. I will not trade without the help of SpotGamma."
David O., SpotGamma Pro Subscriber
WHAT PEOPLE ARE SAYING
"I haven’t experienced a better platform than SpotGamma in my seven years of trading."
Olsi H., SpotGamma Pro Subscriber
WHAT PEOPLE ARE SAYING
"Can I buy a lifetime subscription?"
Max S., SpotGamma Pro Subscriber
Examples of Successful Trades Using Equity Hub
SpotGamma levels are used to find new ideas and to help pick stock entry points
Our proprietary levels are unique and derived from SpotGamma options analysis
Stock Trading Example - MARA
As an example of this strategy, on Monday, July 26, I noticed MARA (a company associated with Bitcoin mining) was trading sharply higher before the open on news that Bitcoin rallied over the weekend. Thinking MARA would be a good long candidate, I began my research with Equity Hub (available to SpotGamma Pro subscribers). The key data from Equity Hub for MARA is shown in the image below.
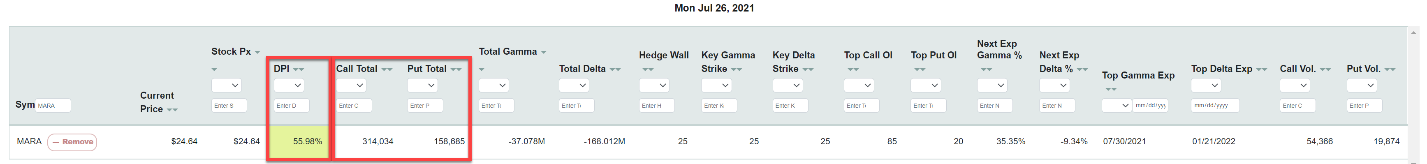
I noticed two items that supported my bullish thesis:
I continued my research by looking at the SG Momentum graph for MARA, shown in the image below.
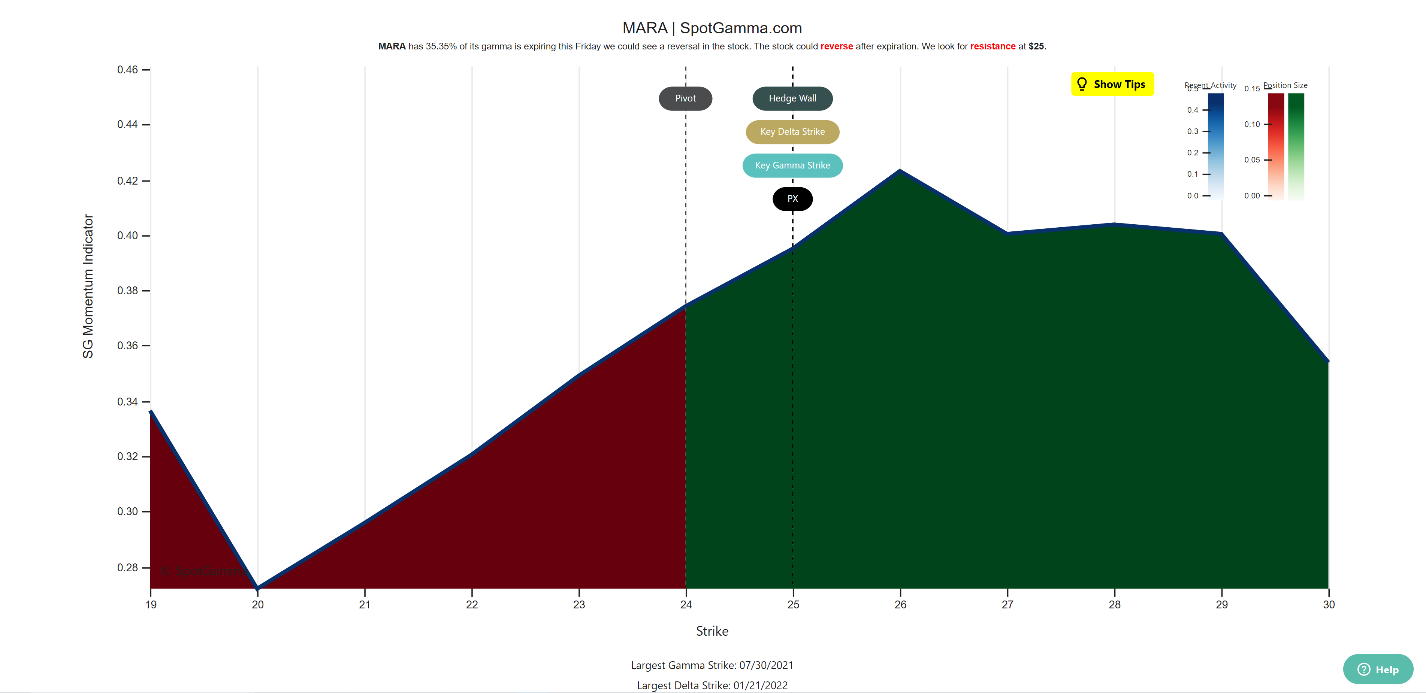
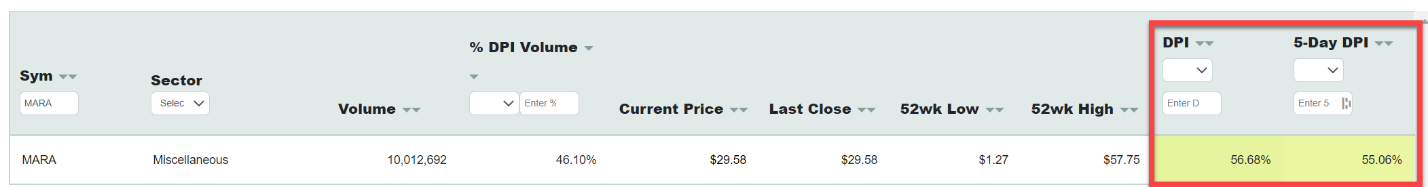
This graph confirmed the high Call Gamma, dominating above the 24 strike and hedging momentum increasing up to 26 and gradually tapering off to 30. For one last check, I entered MARA in the Dark Pool Indicator tool (available to SpotGamma Pro subscribers), shown in the image below. This showed the 5-Day DPI was 55%, indicating strong institutional buying over a period of several days.
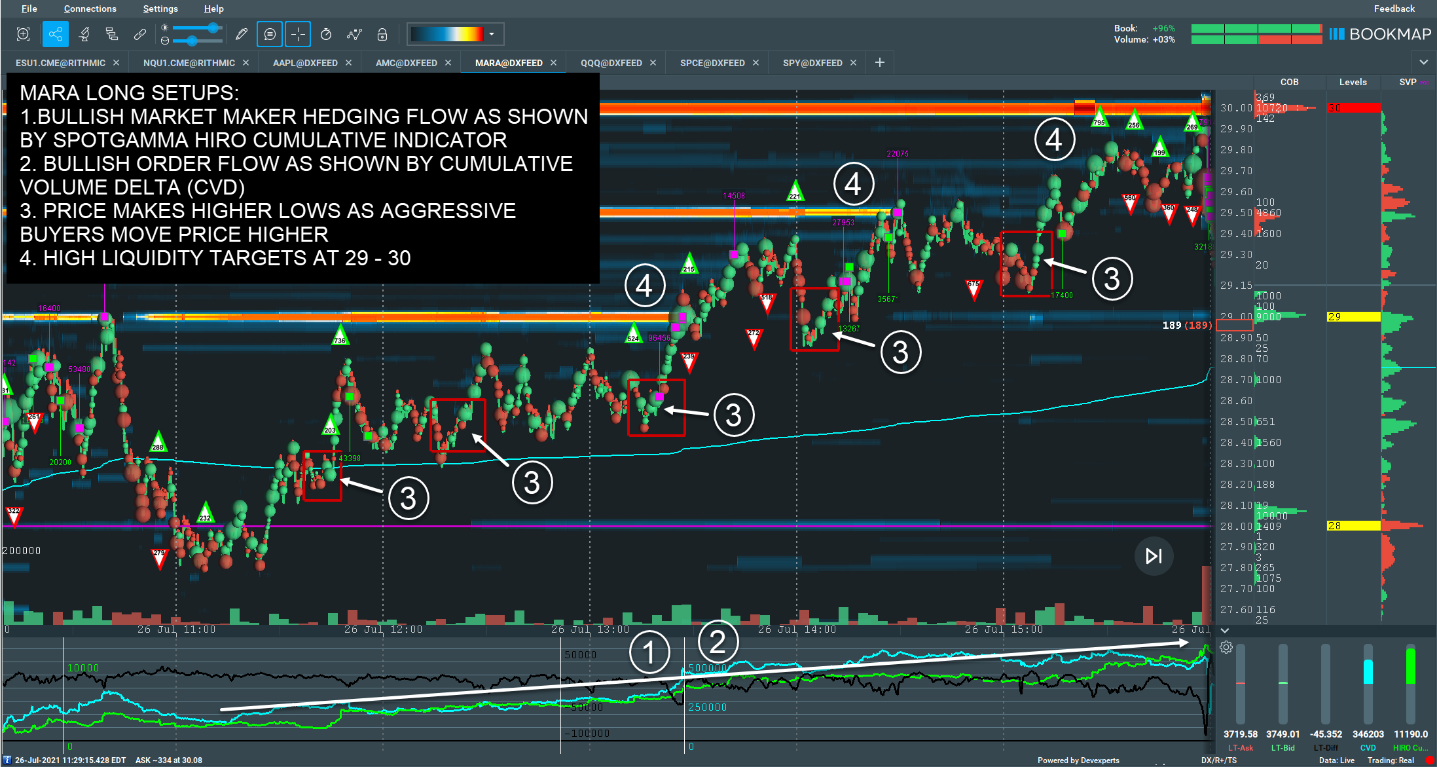
After the open, I began looking for long entries. Around 11:45 A.M. ET, hedging flow began to shift from neutral to bullish as shown by the HIRO Indicator in the Bookmap chart below. There were multiple entry points as shown in the chart, with the high liquidity at 30 as a primary target.
Index Trading Example - QQQ
I begin my morning preparation by reading the Founder's Morning Note when I plan to trade futures. For ES futures, I note gamma levels and key metrics for SPX and SPY. For NQ futures, I note Gamma Notional, and the Volatility Trigger, Put Wall, and Call Wall gamma levels for QQQ.
When I plan to trade NQ futures during the day, I also look up QQQ in Equity Hub. First, I review the data and note the Hedge Wall and Key Gamma Strike. The Hedge Wall is the strike where the largest change in gamma is detected. The Key Gamma Strike is a strike where volatility may increase or decrease. Both levels can act as pivot or pin areas.
Next, I look at the 5-Day History for QQQ in Equity Hub. This shows how the metrics for QQQ have changed over the last five days and can indicate rising and falling sentiment.
Based on this information, I develop a thesis regarding directional bias, anticipated volatility, and trading range for the day. One example of how I used this information to plan and execute trades in NQ futures is shown below.
On August 9, the following metrics for QQQ were shown in the AM Report and Equity Hub:
The 5-Day History also indicated that the Hedge Wall and Key Gamma Strike had risen from the prior day as shown in the image of the 5-Day History from 8/11 below.

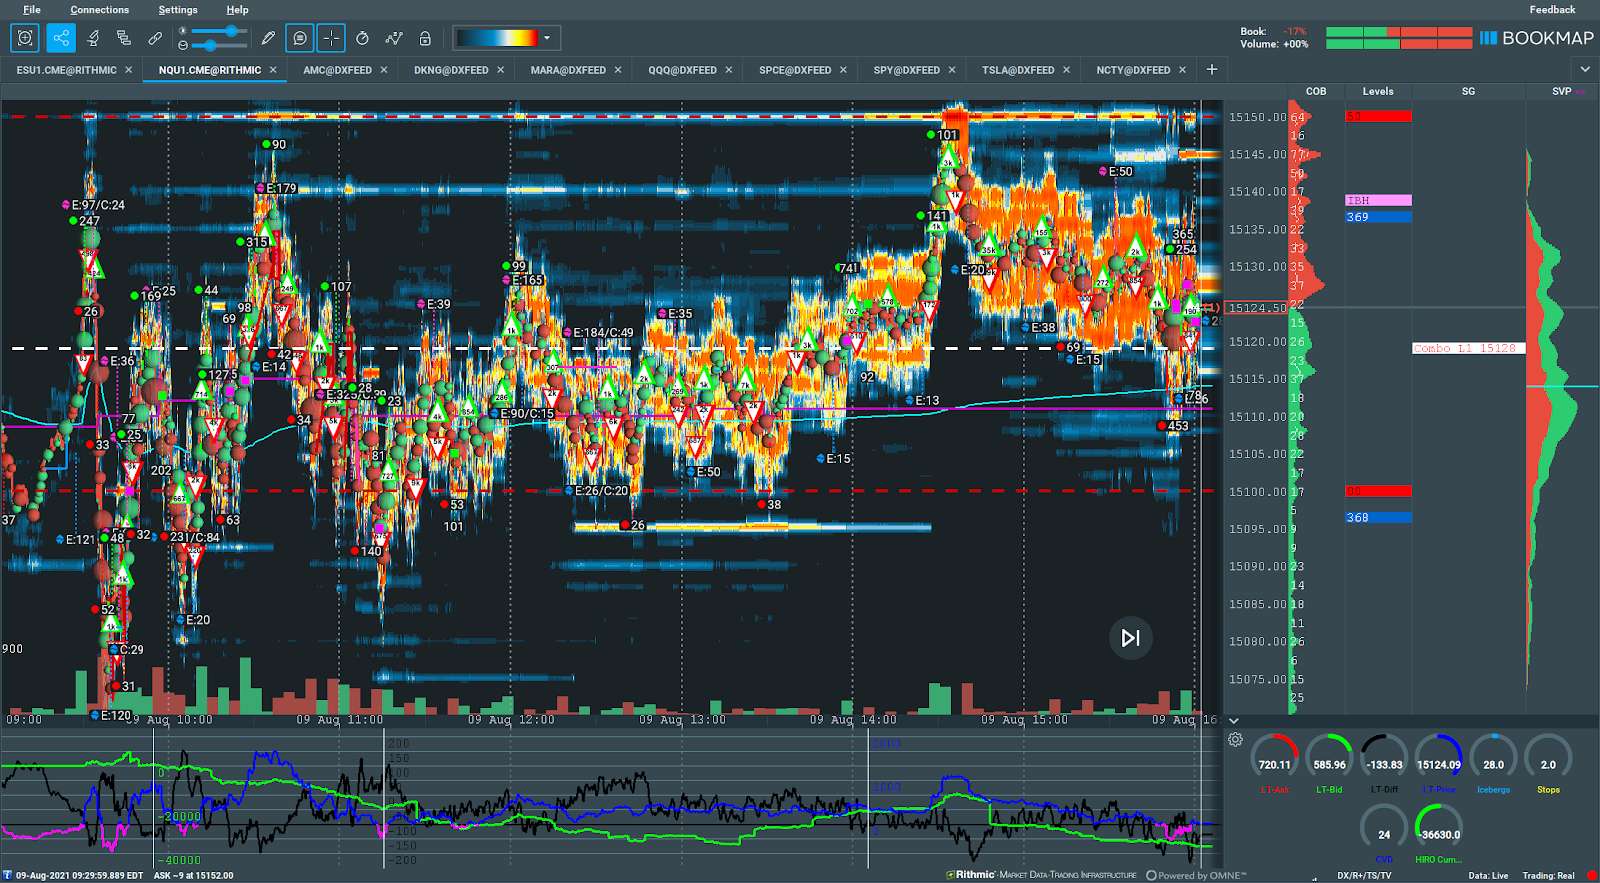
Based on the positive Gamma Notional and a neutral Vanna Model, I was looking for a lower volatility day with a narrow trading range. Based on the rising Hedge Wall and Key Gamma Strike, my directional bias was bullish. I was primarily looking for long entries.
The image below indicates the day played out as anticipated, as shown in Bookmap.
SpotGamma provides key levels for more than 3,500 stocks and indices
Simple Interface
Stock Alerts
Easy Visualizations
Watchlist
Create a custom, personalized list of symbols to monitor and review
10-Day History
View a rolling 10-day lookback on all 3,500+ stocks to see stock movement and levels changes
Real-Time Alerts
Get notified by Call and Put Wall alerts automatically when a specific stock or index reaches a key level
Thousands of people have turned to SpotGamma for options analysis. Join us.
SpotGamma Pro
Sign up for a 7-day free trial of SpotGamma Pro to access Equity Hub™.
"The highlight of my inbox."
- Alex F., SpotGamma Pro Subscriber
"The very first thing we do is go over SpotGamma information to set up our day."
- Bret R., The ARMR Report
"I follow the SpotGamma Index religiously and highly recommend it to all of my students."
- Steve P., SpotGamma Pro Subscriber
secure order form
Pay Monthly
Pay For The Year Upfront (SAVE 25%)
*Note: You will be charged after the 7-day free trial ends
