S&P 500 Stock Market Gamma Trading Levels Based on Options Open Interest
Is stock volatility about to pop?
Monday
January
01
1999
Try SpotGamma HIRO Indicator for Free
Real-time options data
See when options drive stocks
0DTE filter for short-term trades
Subscribe to the industry's #1 platform delivering daily expert analysis to unveil:
Proprietary market levels
Bullish or bearish stocks
Hidden trading risks

Key Takeaways
The Vol Chokepoint
Volatility is at lows as traders start to eye debt ceiling concerns. These lows in volatility could serve to drive volatility higher, amplifying any negative reaction debt ceiling reaction.
Watch the video below for full examination:
Access today's Founder's Note for FREE!
Expert commentary packed with proprietary key levels, major support and resistance targets, and market analysis.
By subscribing, you agree with our Privacy Policy and provide consent to receive updates from our company.
Why volatility hitting a one-year low matters for stock traders, options traders, and futures traders
Transcript below:
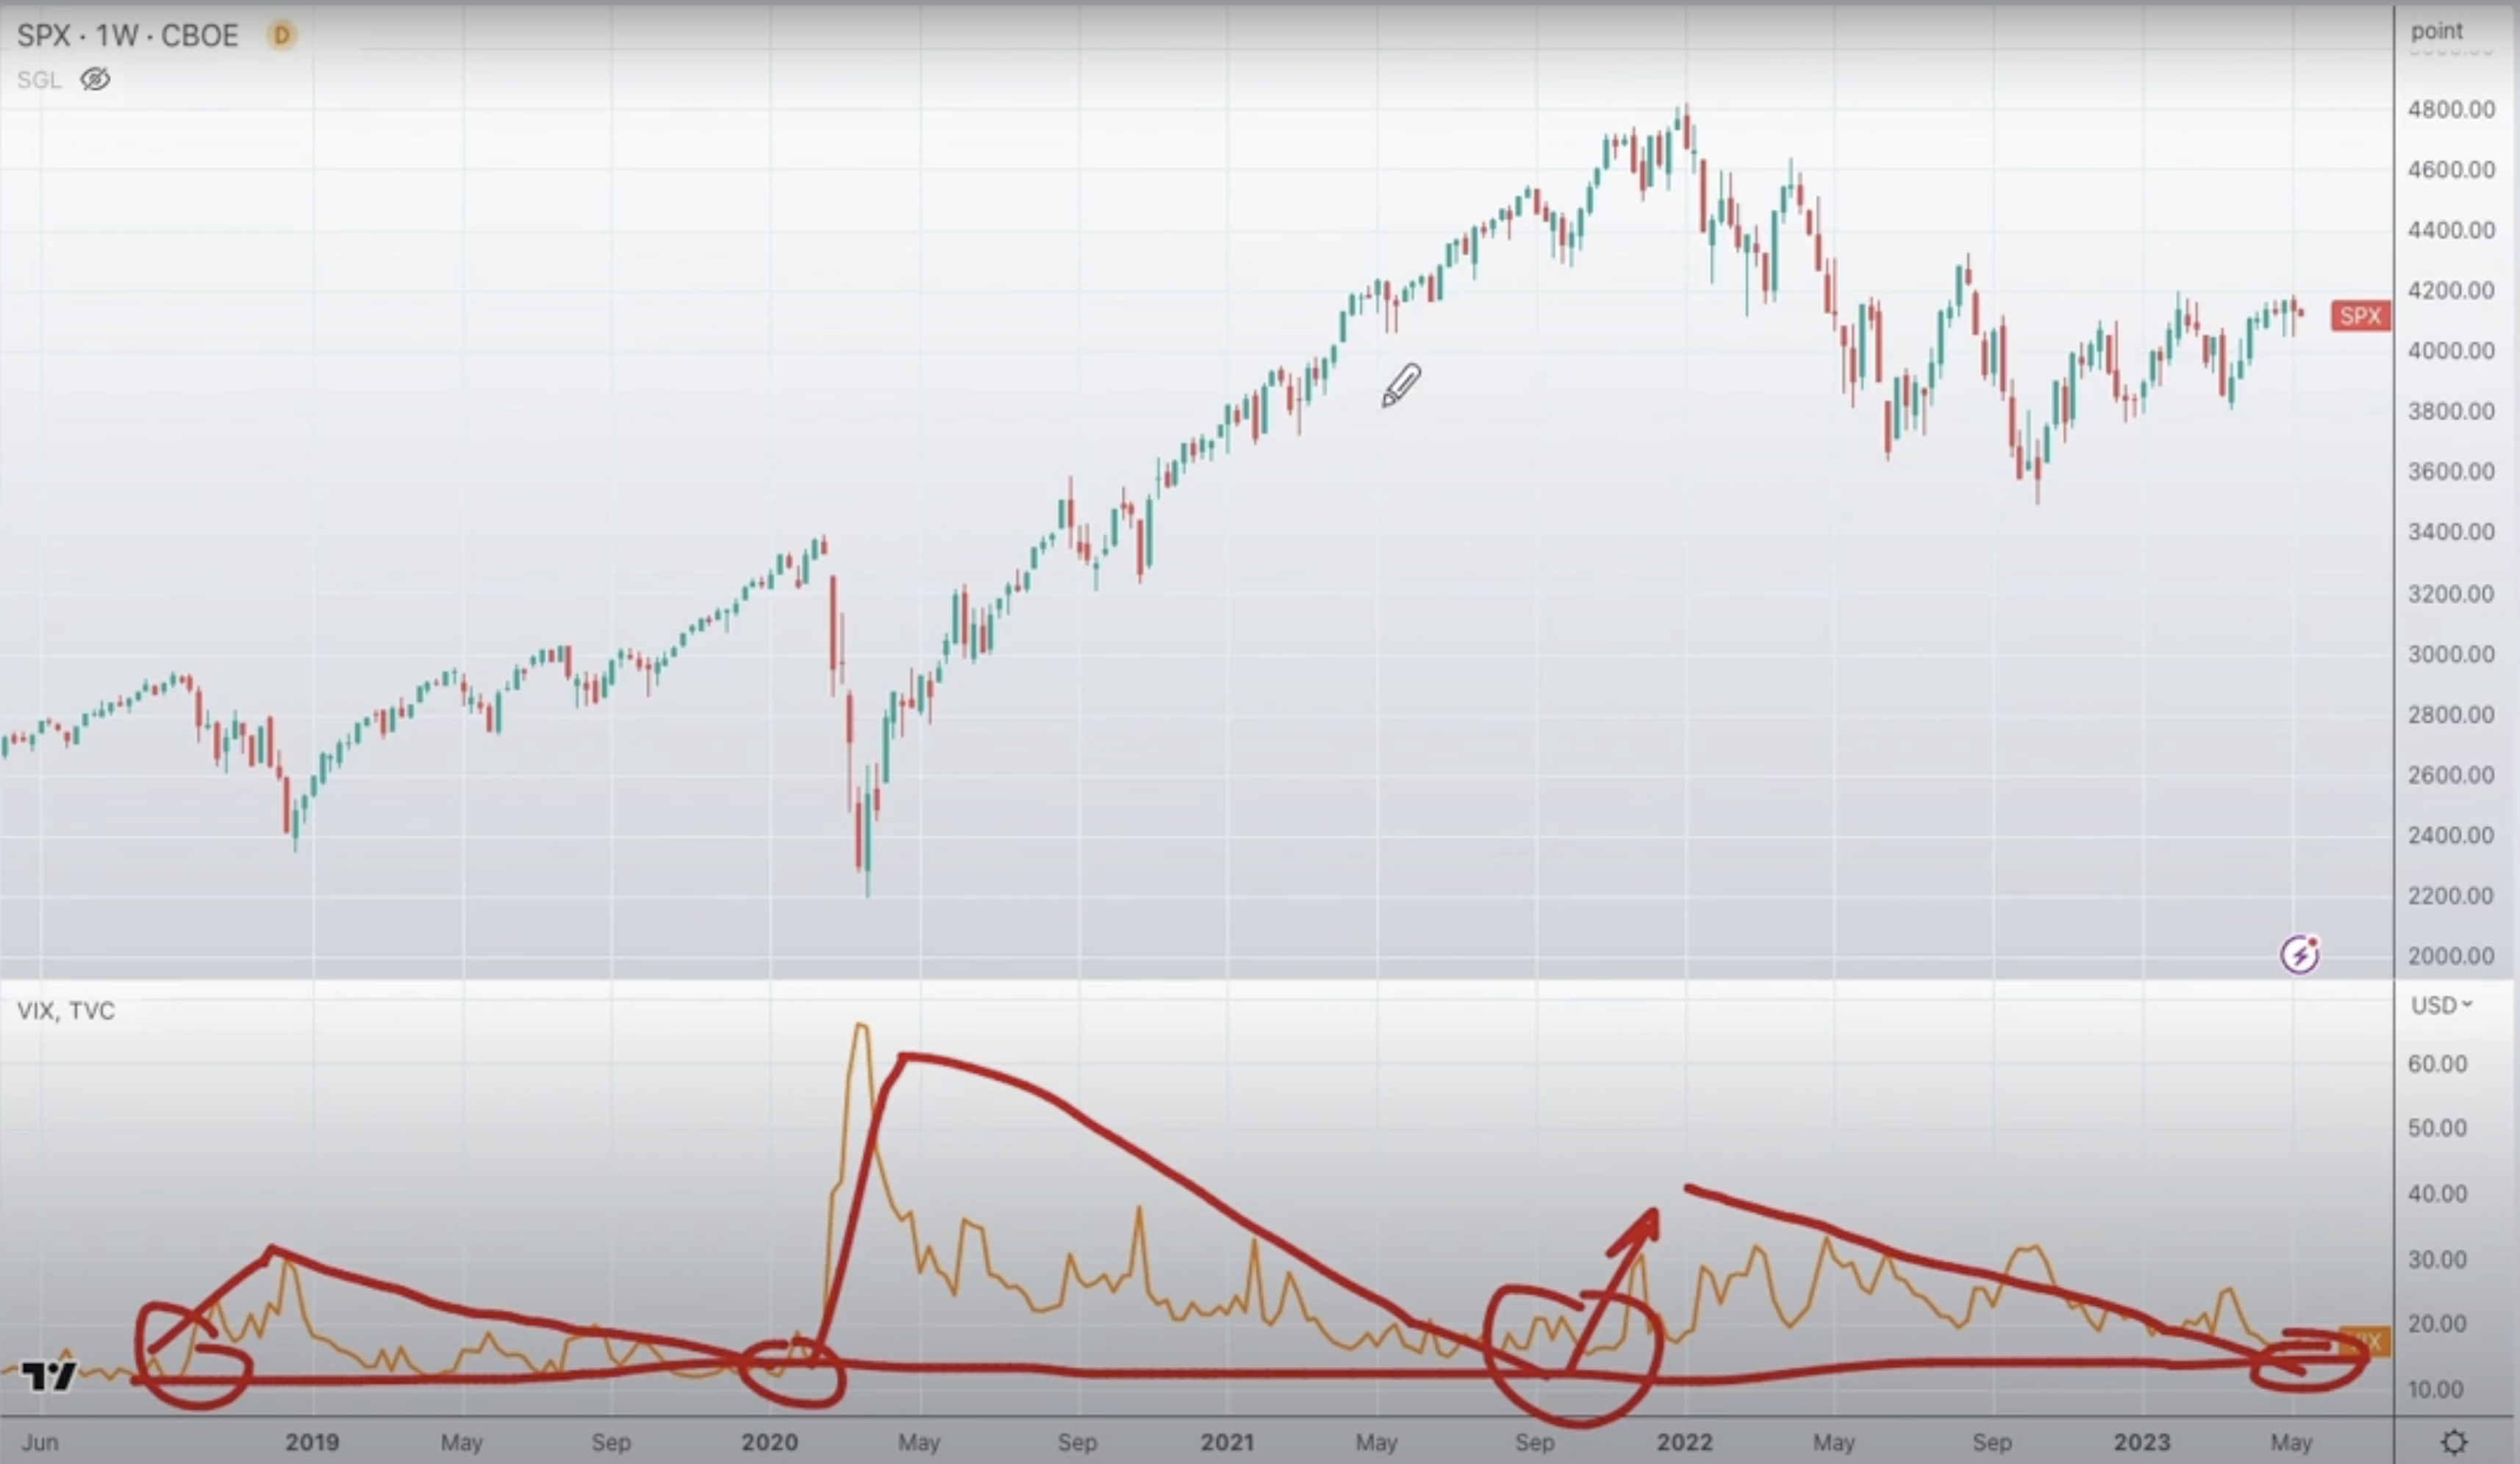
Today, let's talk about volatility. It just hit one year lows, and I want to tell you why it may matter to you whether you trade options, stocks, or futures. On your screen here at the top is the S&P 500, and on the bottom is the VIX. Now, most people think of the VIX as the "fear gauge," but what it really is doing is it's measuring trader's expectations of volatility in the future.
In other words: How much do traders think the market's gonna move in the next 30 days?
As the VIX goes lower, obviously traders are anticipating less market movement. Now, if you've ever read an options book or listened to options people talk, they likely have talked about the fact that volatility tends to mean revert.
Now, what does that mean?
Well, if the market crashes and volatility spikes, volatility tends to come back down as the problem subsides or goes away.
Now what's interesting about this, is it exists over multiple timeframes. You have short term vol spikes that come back down and daily vol spikes that come back down. And then volatility also tends to mean revert over the long term.
Now what I mean by that is, is that if you look, you can see that there is a lower bound for VIX and for volatility.
And what tends to happen is we get these big vol spikes, and then over several months, volatility feeds back down into this lower bound.
So if you look, there was a spike in late 2018, and then right before January of 2020 of vol spikes. Late in 2021, the same thing. September, pretty quiet, December, markets got a little bit rocky. January, vol really spiked. And then you fast forward to today, it's the same thing: Volatility is slowly over the monthly kind of timeframe, and mean reverting back down to this 15 or 16 area.
Now, why is there this lower bound in volatility? For that, let's use what we call the rule of 16.
What that tells us is if we divide the VIX price, let's just say it's 16 for sake of math, if we divide the VIX price by 16, that gives us 1%. So what is 1%? That is how much market movement traders expect for the S&P 500 for one single day. So what is one-day SPX volatility? That's 1%, very clean and easy.
Now, if we go to 12 in the VIX and we divide that by 16, we get 75 basis points.
So what that tells us is that traders are expecting pretty small amounts of movement. And what this creates is this problem, right?
Because while we think of volatility as being a driven by fear or downside market movement, technically speaking, volatility exists both ways.
If the market starts to rip and go higher, that creates volatility and the VIX could go up as a result. We don't usually see it happen, but it's possible. It does happen occasionally. And so what this means is that when the VIX hits this lower bound? It starts to have to rise whether the market goes up or down, right?
So it creates this lower bound. Now, if you're more sophisticated, this lower bound concept comes in with measurements of realized volatility, but we're gonna talk about that another time.
Now, the second thing about volatility that we think is interesting or that needs to be pointed out is that there is this reflexivity in volatility, particularly with traders that like to sell volatility.
And what I mean by that is, it's very well illustrated here, is that we had with the Covid crash.
And then we have the volatility low here in September, and what you can see is there's this very clear, long-term decline in volatility where the VIX tends to mean revert around this average, right? And so what happens is there's the huge spike that everyone freaks out about, and then you get these smaller episodic spikes, which maybe aren't due to systemic risk, more just local risk.
But those are quickly met with volatility sellers, right? It's a very popular strategy: You wanna sell short dated options or sell VIX linked products etc.
And so what happens is that over time, the volatility comes lower and traders start to sell smaller and smaller relative spikes in volatility, right?
Because if you wanna try to get that a little bit extra premium, you gotta start selling vol when it comes out a little bit faster, right? You kind of get spoiled as a vol seller, but if you shorted the Covid low or the Covid high in volatility, and you rode that wave down, you get spoiled by wanting that price action, right?

So it becomes this race to sell incrementally smaller spikes in volatility until we hit this choke point (or R) or realized low, and you can see that again, occurring really from late last year down to May of last week. This was May 2nd.
We hit the VIX at 15. So what does that mean for today?
Well, let's just fast forward a little bit to what's happened over the last year and what you can see is that indeed, after we had the August spike, we had a very big low down here in October. Really since October, volatility has been trending quite a bit low over time and up until March there really weren't any major problems.
People wanted to talk about how much the Fed may or may not raise rates, but by and large, systemic risks have been off the table. Now that changed obviously in March, and as you can see. We kind of moved lower and lower in volatility. The spikes got relatively lower. There's this damping effect and all of a sudden Silicon Valley Bank goes bankrupt and the VIX spikes rather violently.
And the market drops 7% in the course of about a week or two.
And so you can see that we compress volatility and then it just explodes! And then what happens is as the Fed comes out and says,
"Hey, we got your back here, things should be okay with these banks."
Traders get more emboldened to start selling volatility.
So then you can see that the VIX gets crushed again down into one year lows.
And so right now, we sit here with volatility right off of one year lows with the VIX about 17.
Realized volatility, if you pay attention to that, is at 14%. And so the market has had very little movement over the last 30 days and traders are pricing in very little movement.
Now today, this is again May 9th, Biden and McCarthy are gonna have a round of debt ceiling talks, and if they resolve things, then maybe this low volatility persists. If they don't resolve things, what we have is a market that is primed for no volatility.
If there is a spike in volatility, if Biden and McCarthy say, "Look, this is gonna take months to fix. There's a lot of trouble here." Then risk is suddenly gonna ratchet higher, and anyone who is short these lows in volatility are gonna have to run for cover, and that can exacerbate a market decline.
We think that, "Hey, why did the VIX hit 30 with Silicon Valley Bank going down? And the market crashed 7% so quickly?"
Yes, it was a very big issue. But. We think it was likely exacerbated by the fact that volatility started from such a low point.
Traders were expecting very little market movement and then suddenly had to price very large possible risk or very high market movement. And so again, as we sit here at this crux, we have what could be some very real issues with traders pricing in almost no risk.
And so if things start to slide a little bit, or a headline comes across that suggests that there could be longer term risks here, that run for cover could again really lead to a rather sharp drawdown.
Now we have not only that issue, we would also say that if you look at, and we've been talking about this in our subscriber notes, if you look at the S&P 500 over the long term, this 4150 to 4200 areas have been a long term resistant zone.
And the structure of the market as we see it here, is just not supporting. We're not looking like there's gonna be a strong rally up above that, at least over the next couple of weeks.
And so we have this kind of high point, or pinch point to the upside in market prices, and this low in volatility that is also kind of a pinch point, and it makes for this moment in time where certainly shorting volatility doesn't seem to, offer much reward. This doesn't necessarily mean you wanna get long volatility, but we do think if you are long stocks or short volatility, you kind of wanna start to pay attention to some of the dynamics that are setting up.
Subscribe to the industry's #1 platform delivering daily expert analysis to unveil:
Proprietary market levels
Bullish or bearish stocks
Hidden trading risks
Supercharge your trading strategy. Subscribe today.
