S&P 500 Stock Market Gamma Trading Levels Based on Options Open Interest
Choose the plan you want
7-day free trial with every plan!
Standard
$89/mo
Founder's Notes & Expert Commentary
Unique Support & Resistance Levels
Daily Trading Ranges
Index Charts with Key Levels
Options Flow Data
Delta, Vanna, & Gamma Models
0DTE Volume / Open Interest Indicator
Monthly OPEX Analysis
Trading Platform Integrations
Discord Membership
Weekly Subscriber-Only Webinars with Q&A
------
------
------
Billed annually (Save $264/year)
$1,068 $801/yr
Founder's Notes & Expert Commentary
Unique Support & Resistance Levels
Daily Trading Ranges
Index Charts with Key Levels
Options Flow Data
Delta, Vanna, & Gamma Models
0DTE Volume / Open Interest Indicator
Monthly OPEX Analysis
Trading Platform Integrations
Discord Membership
Weekly Subscriber-Only Webinars with Q&A
------
------
------
Pro
$129/mo
Founder's Notes & Expert Commentary
Unique Support & Resistance Levels
Daily Trading Ranges
Index Charts with Key Levels
Options Flow Data
Delta, Vanna, & Gamma Models
0DTE Volume / Open Interest Indicator
Monthly OPEX Analysis
Trading Platform Integrations
Discord Membership
Weekly Subscriber-Only Webinars with Q&A
Equity Hub
------
------
Billed annually (Save $384/year)
$1,548 $1,161/yr
Founder's Notes & Expert Commentary
Unique Support & Resistance Levels
Daily Trading Ranges
Index Charts with Key Levels
Options Flow Data
Delta, Vanna, & Gamma Models
0DTE Volume / Open Interest Indicator
Monthly OPEX Analysis
Trading Platform Integrations
Discord Membership
Weekly Subscriber-Only Webinars with Q&A
Equity Hub
------
------
*BEST DEAL!
Alpha
$249/mo
Founder's Notes & Expert Commentary
Unique Support & Resistance Levels
Daily Trading Ranges
Index Charts with Key Levels
Options Flow Data
Delta, Vanna, & Gamma Models
0DTE Volume / Open Interest Indicator
Monthly OPEX Analysis
Trading Platform Integrations
Discord Membership
Weekly Subscriber-Only Webinars with Q&A
Equity Hub
HIRO
Implied Volatility Dashboard
Billed annually (Save $747/year)
$2,988 $2,241/yr
Founder's Notes & Expert Commentary
Unique Support & Resistance Levels
Daily Trading Ranges
Index Charts with Key Levels
Options Flow Data
Delta, Vanna, & Gamma Models
0DTE Volume / Open Interest Indicator
Monthly OPEX Analysis
Trading Platform Integrations
Discord Membership
Weekly Subscriber-Only Webinars with Q&A
Equity Hub
HIRO
Implied Volatility Dashboard
Choose the Plan that's right for you
To celebrate the release of our new powerful lens to see the hidden forces driving the stock market, try the Alpha plan!
Standard
$89/mo
First month $17, then $89/mo
Pro
$129/mo
First month $25, then $129/mo
Alpha
$299/mo
First month $49, then $249/mo
Standard
Normally $89/mo
$67/mo
Billed annually at $801
(Saves $267/year)
Pro
Normally $129/mo
$97/mo
Billed annually at $1,161
(Saves $387/year)
Alpha
Normally $299/mo
$224/mo
Billed annually at $2,691
(Saves $897/year)
SpotGamma is the global leader in positional analysis and welcomes any trader to join us and see what the professionals see
new! directional + volatility signals
COMPASS
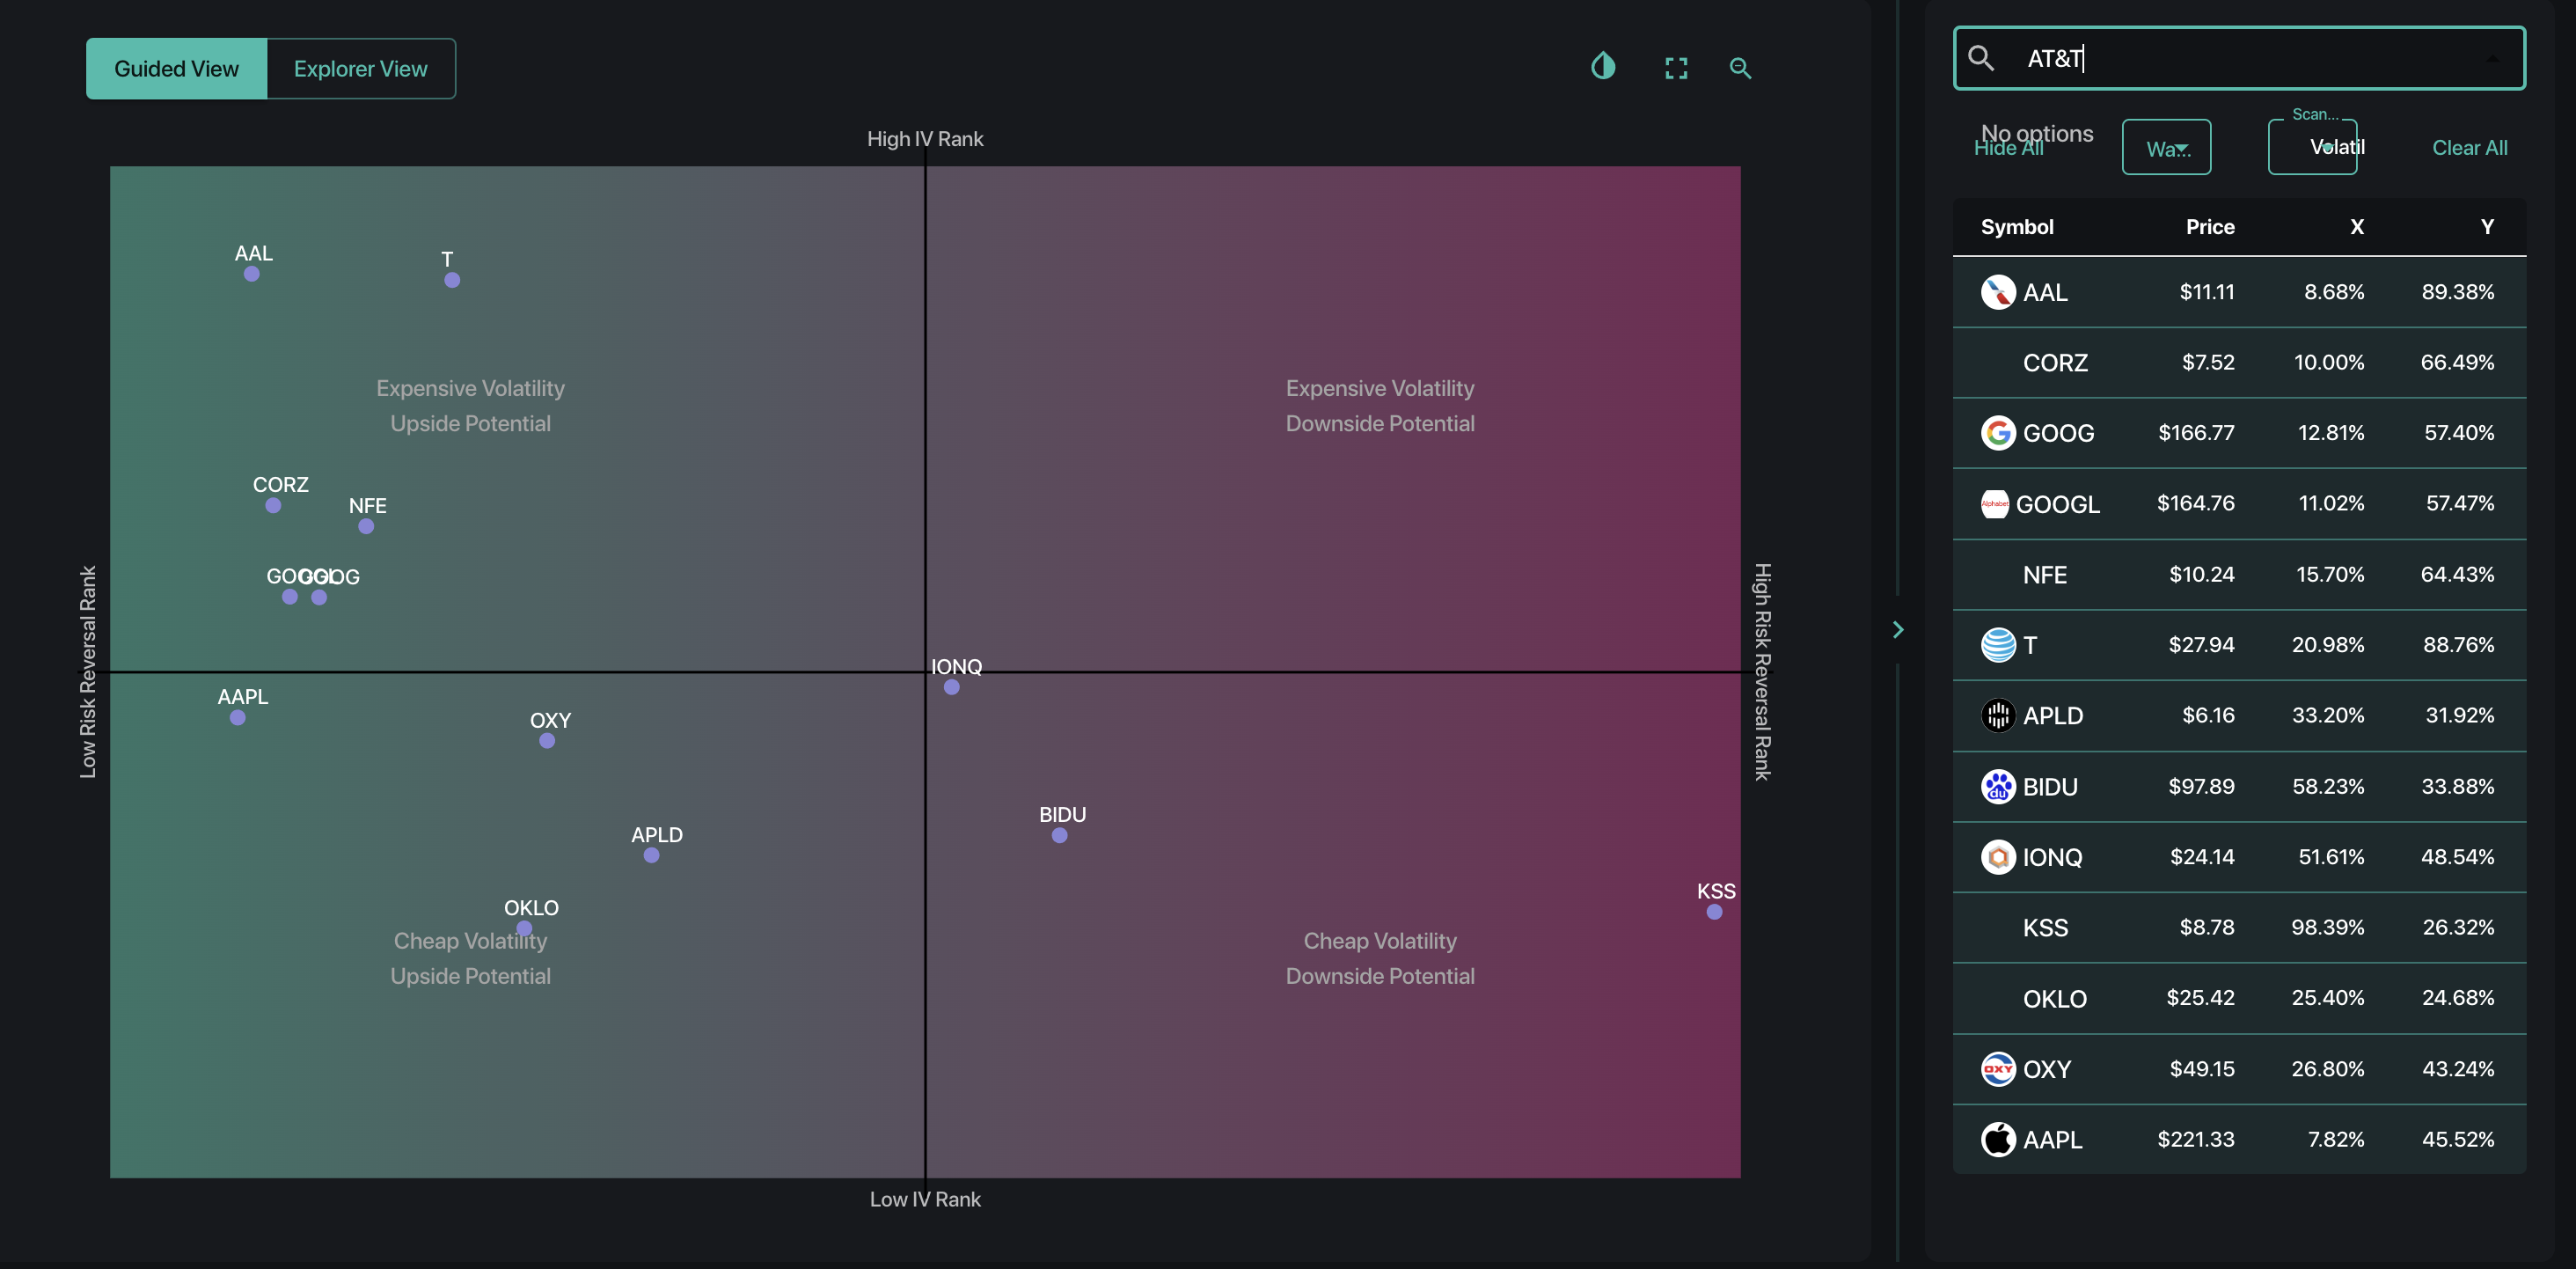
Compass is SpotGamma’s proprietary super scanner that enables you to discover new trade ideas and analyze the best ways to trade your favorite names. With Compass, you can plot multiple stocks across a 2-dimensional grid to assess both the volatility expectations and directional positioning for those names. Compass empowers you to see if the stocks you follow have relatively high or low implied volatility, with a bullish or bearish setup. Compass also allows for completely custom axes, plotting over a dozen different metrics on the grid.
HEATMAP THE S&P 500
TRACE
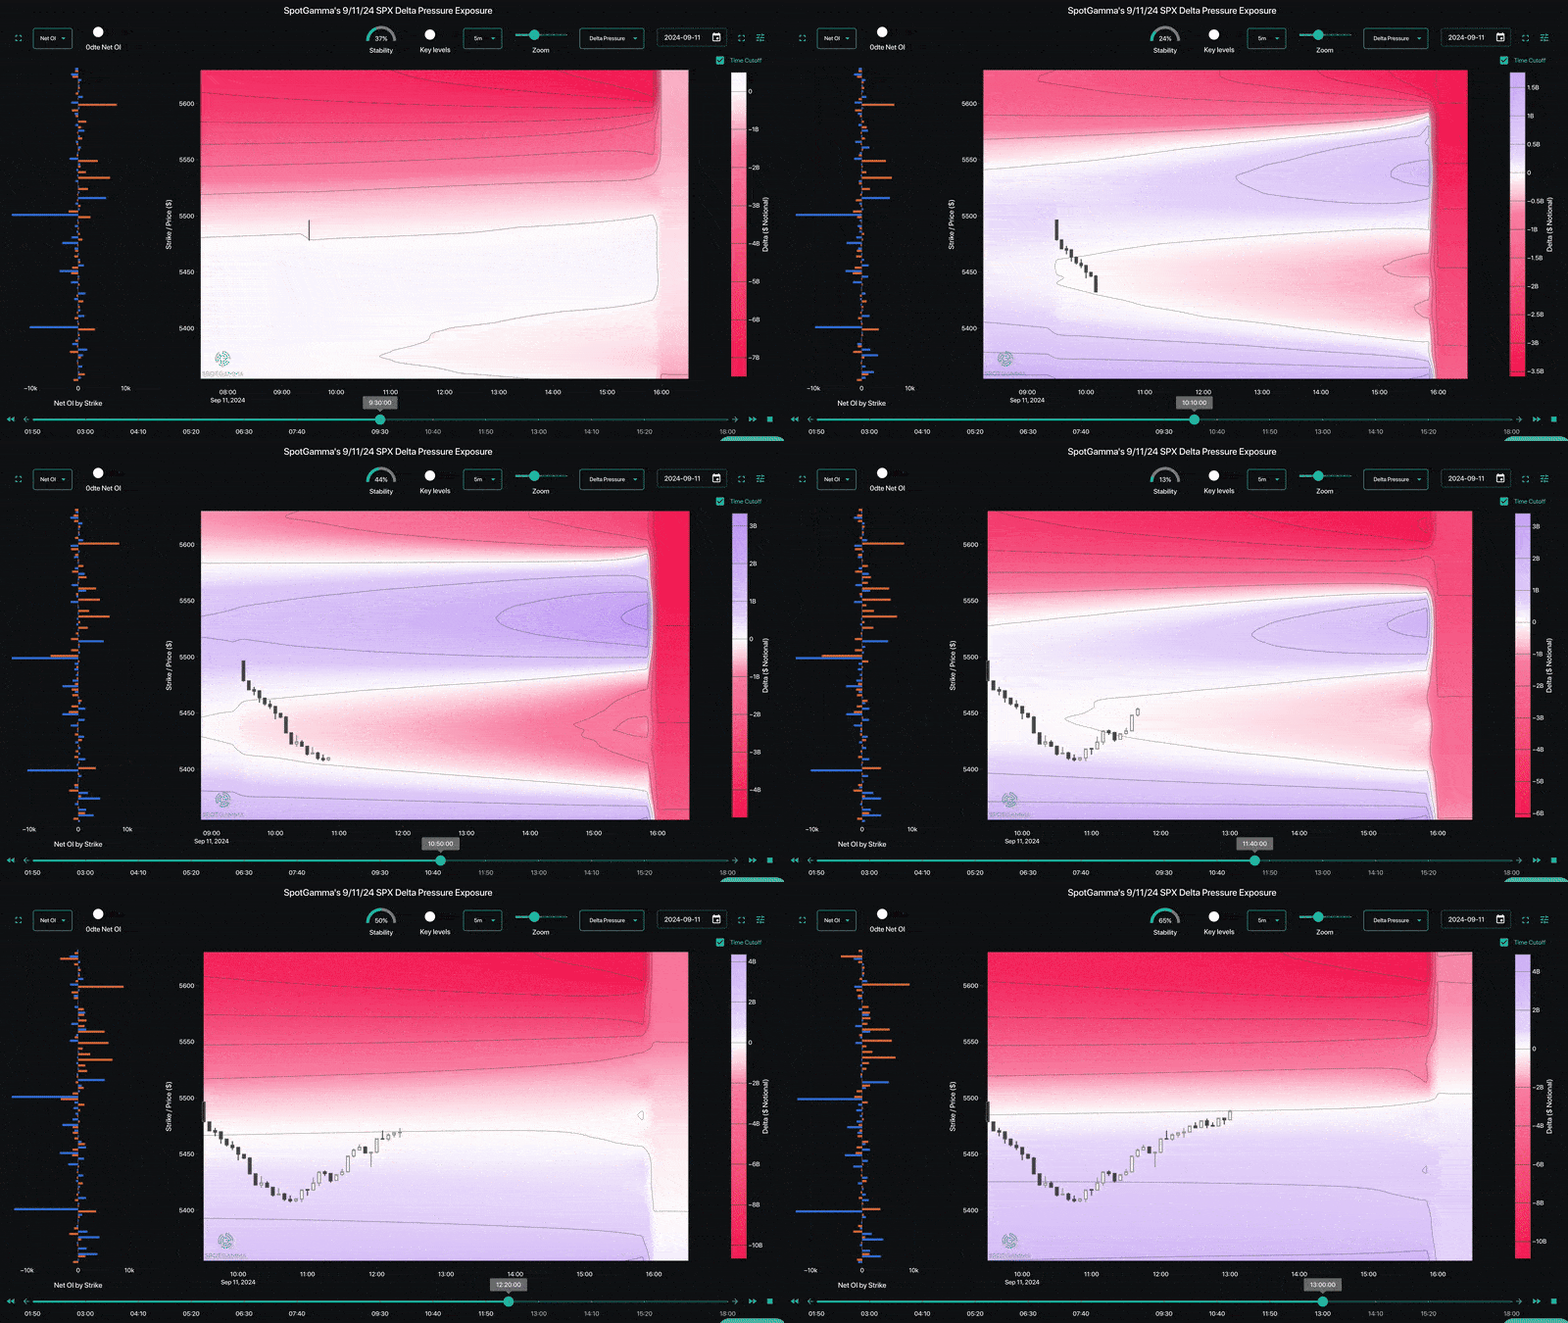
TRACE is a powerful tool designed to help you visualize how the options market exerts pressure on the SPX Index in real time. TRACE unveils where the SPX Index may find zones of support & resistance, areas of heightened volatility, and price consolidation throughout the trading day. Built off of SpotGamma’s proprietary Options Inventory Model, TRACE ingests all options traded across the US exchanges to display the dynamic influence of the greeks using three models: Gamma, Delta Pressure, and Charm Pressure. Additionally, TRACE features a strike plot showing gamma exposure and open interest across strikes, showing you the levels to watch for market movement.
real-time options impact
hiro
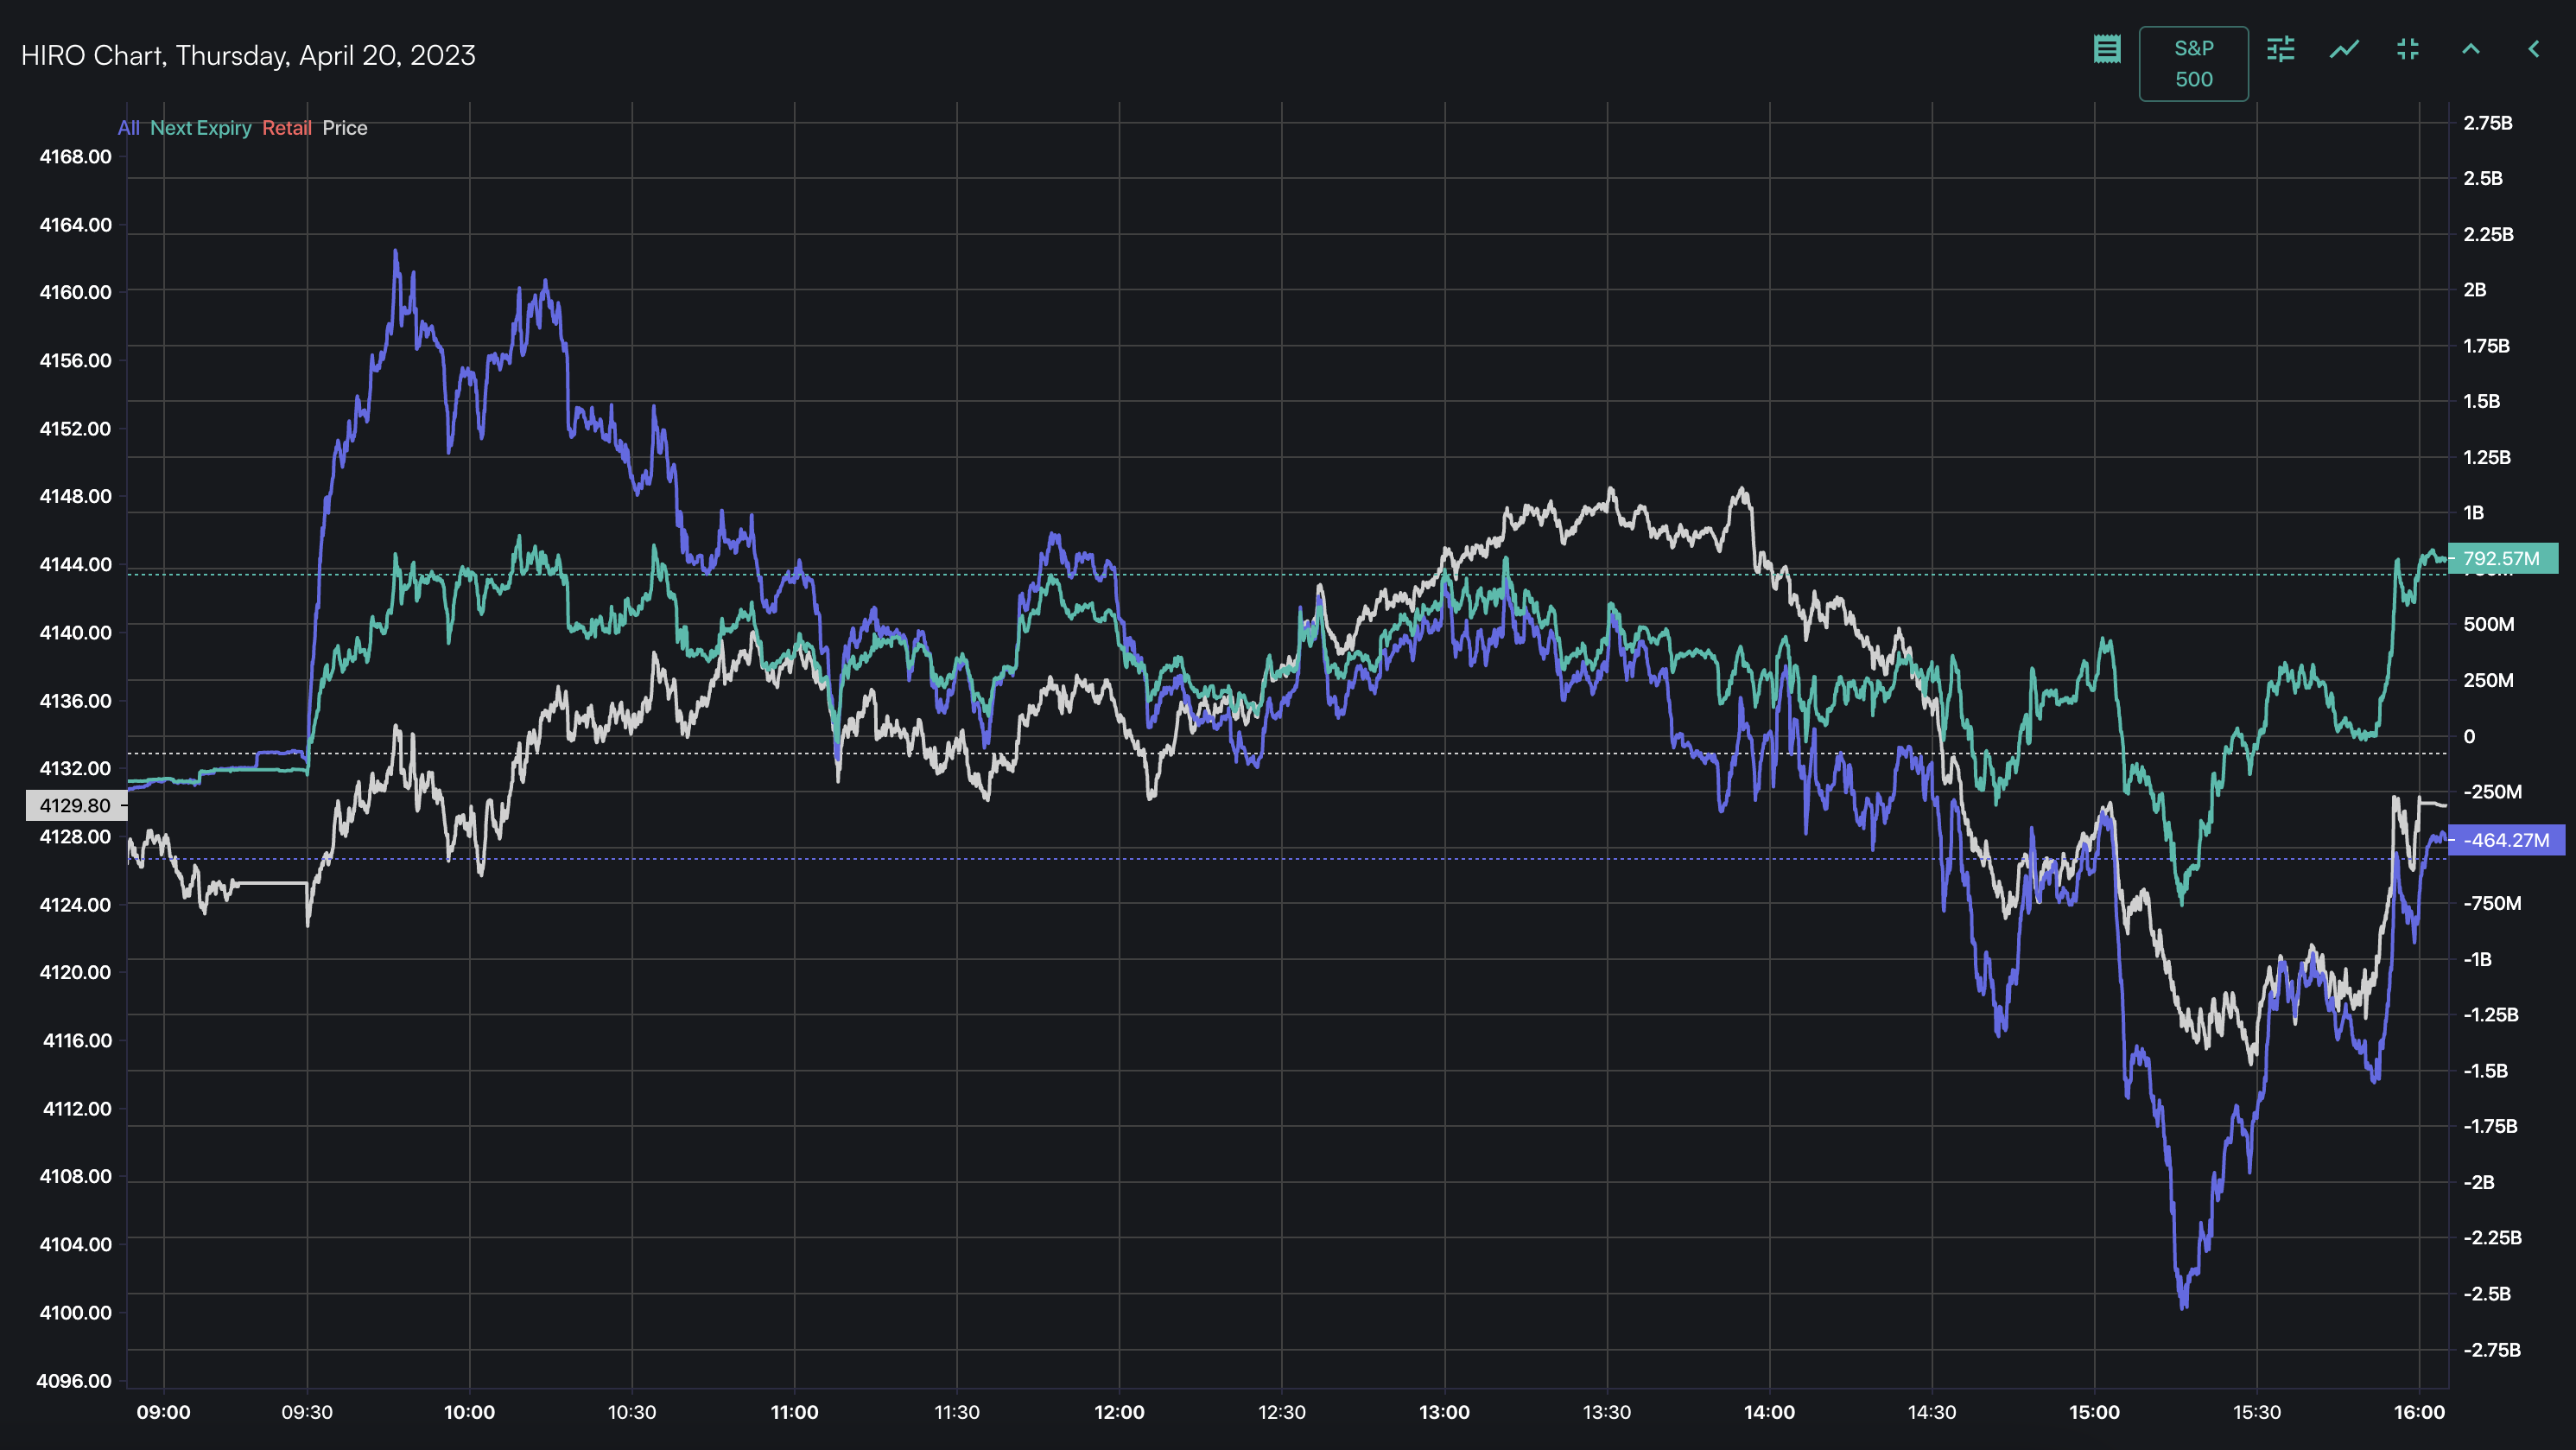
For intraday traders, SpotGamma’s HIRO indicator excels at monitoring for momentum and reversal plays across the top options-driven names. HIRO stands for "Hedging Impact Real-Time Options" and that is exactly what this indicator does: Leverage SpotGamma’s proprietary algorithms to capture the impact of all options trades as they occur. One of the strongest forces in the market is that of options hedging, and this mechanism can lead to rapid fluctuations in prices. The HIRO indicator considers the entire US Options Market and projects key information relative to the hedging requirement for each of those trades. HIRO then translates millions of individual options trades and their estimated impact on the markets into an easy-to-read graphic.
daily expert commentary & options analysis
Founder’s Notes
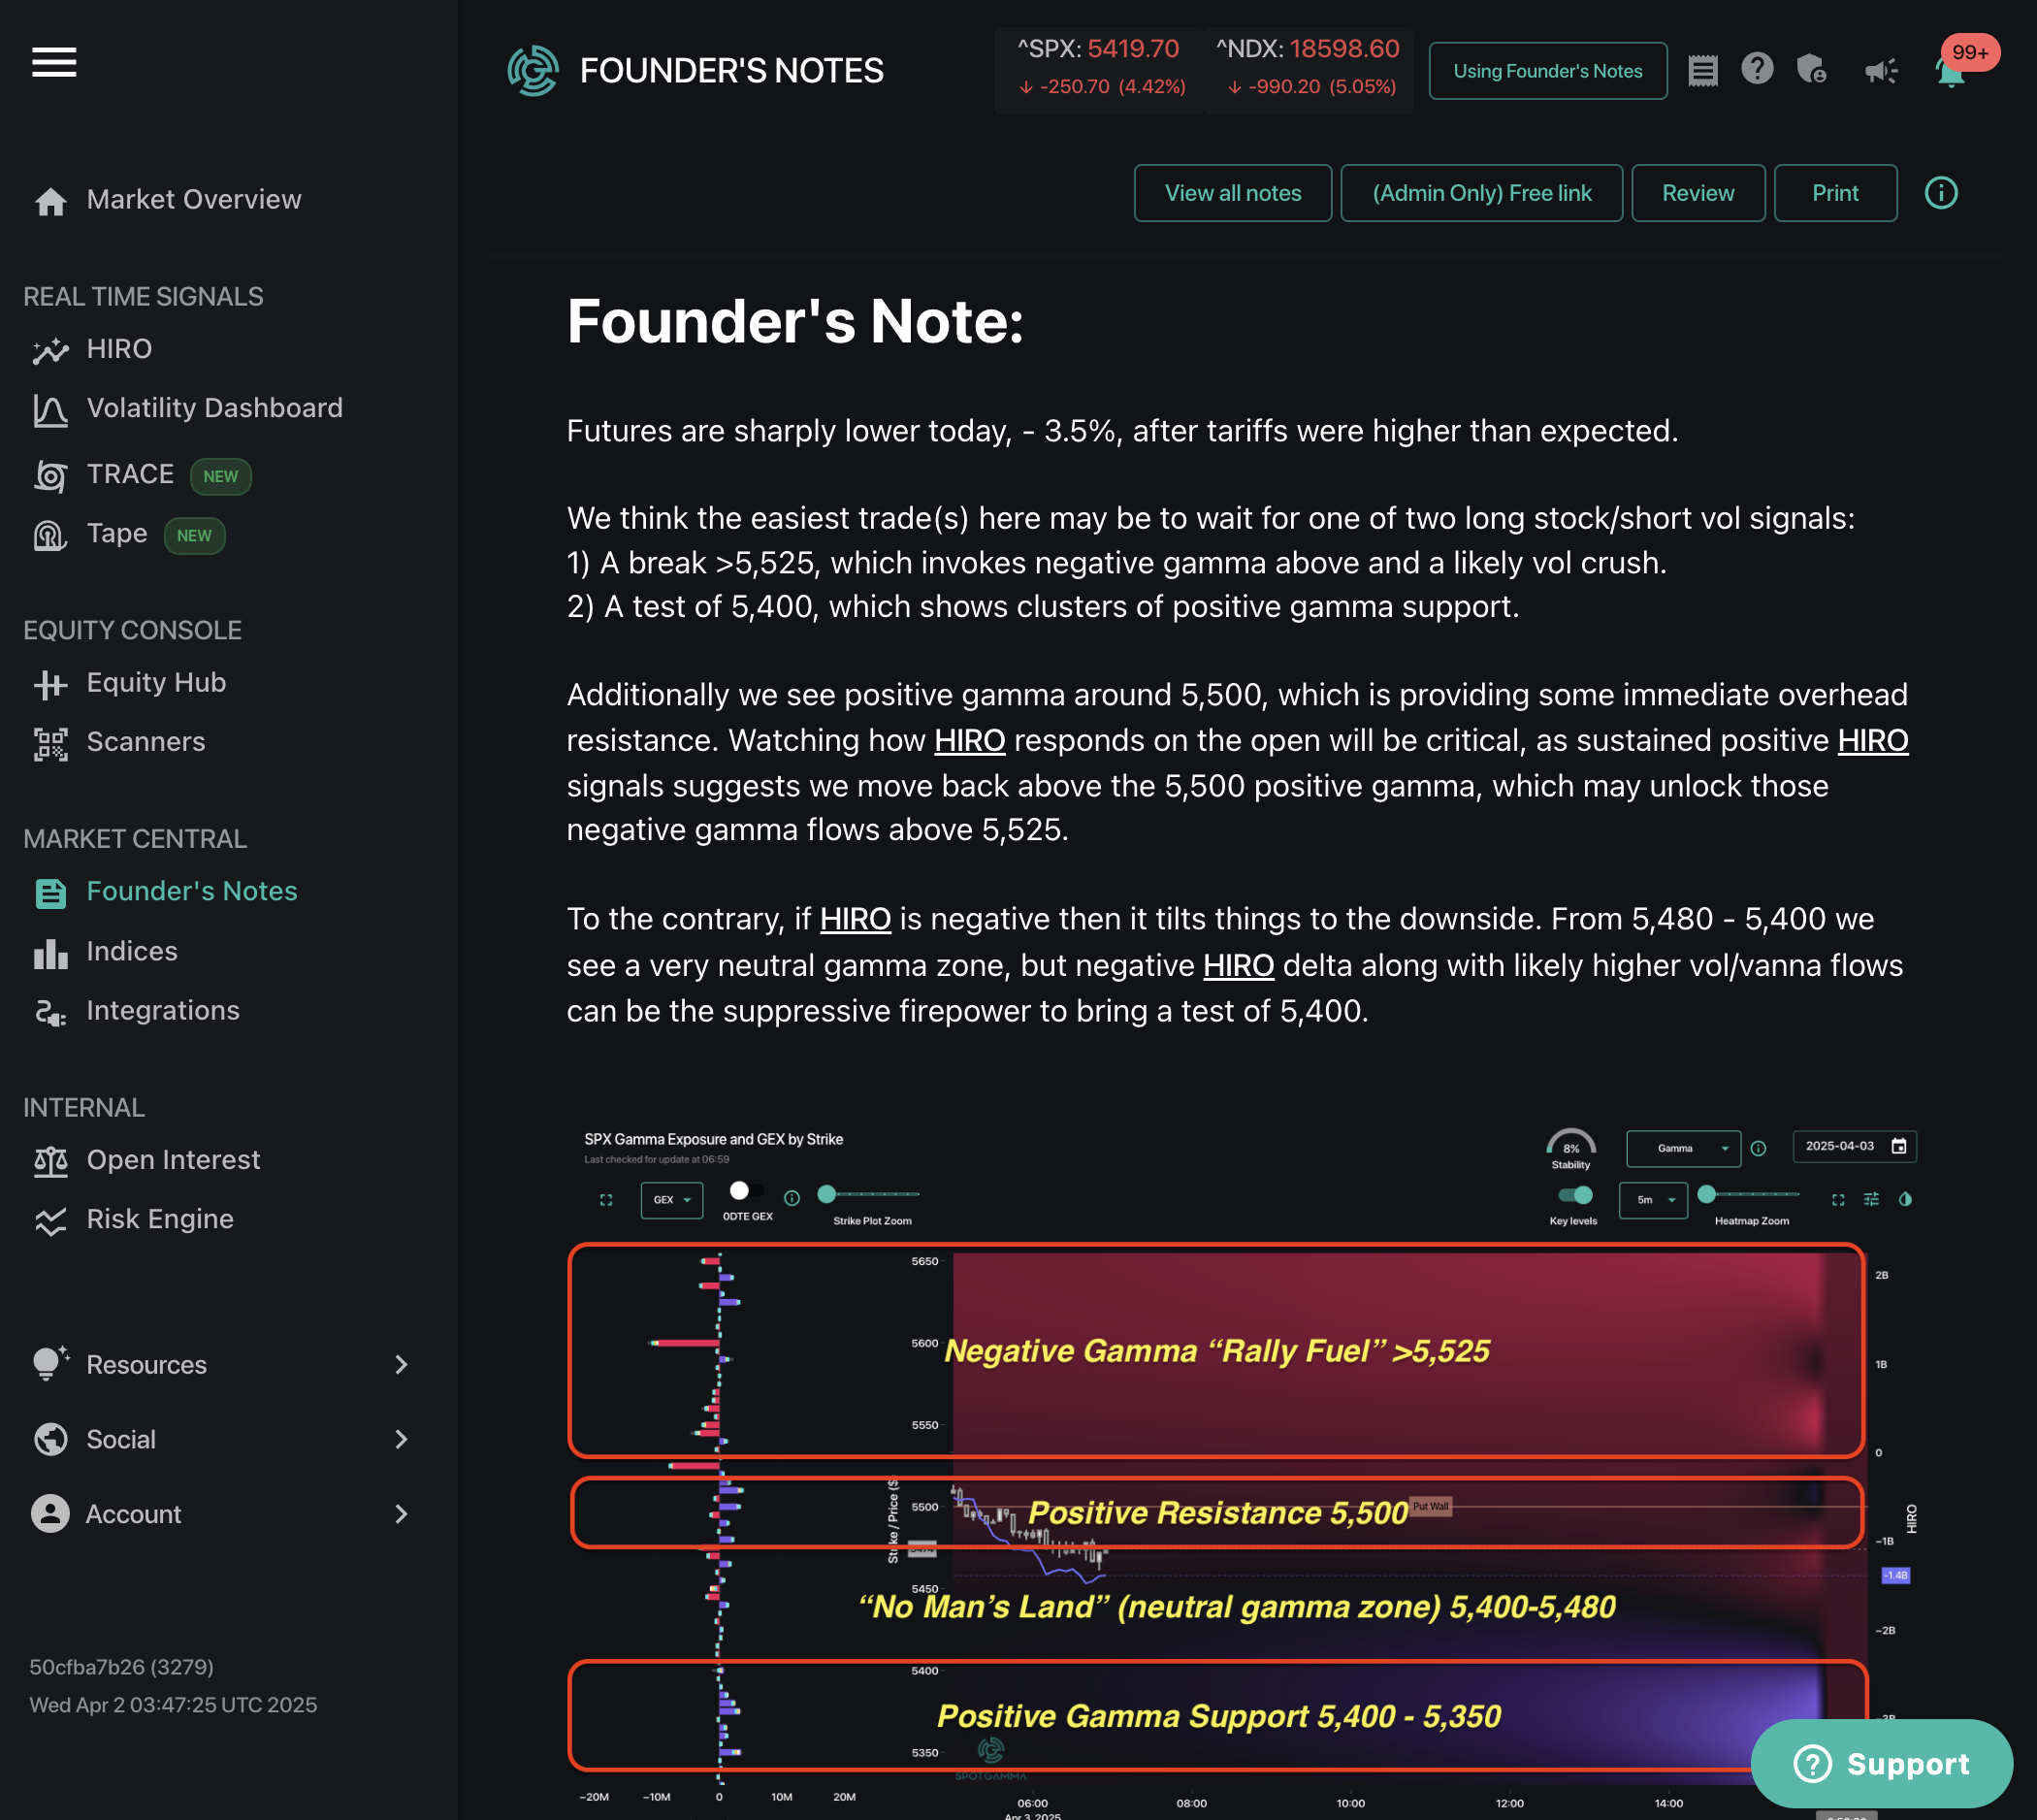
The SpotGamma Founder’s Notes provide bespoke analysis covering the impact of options on the broader markets. Written and delivered to SpotGamma subscribers pre-market open and post-market close every trading day, the Founder’s Notes include descriptions of the current market dynamics, detailed observations about trends our team has observed, and proprietary levels where we expect to see market movement across the major US indices. The Founder’s Notes are repeatedly cited as one of SpotGamma’s most foundational and popular products available to traders. These brief reads are a great way to set up your trading day and to gain insights into where buyers and sellers are likely to enter the market.
support & resistance for 3,500 + stocks
Equity Hub
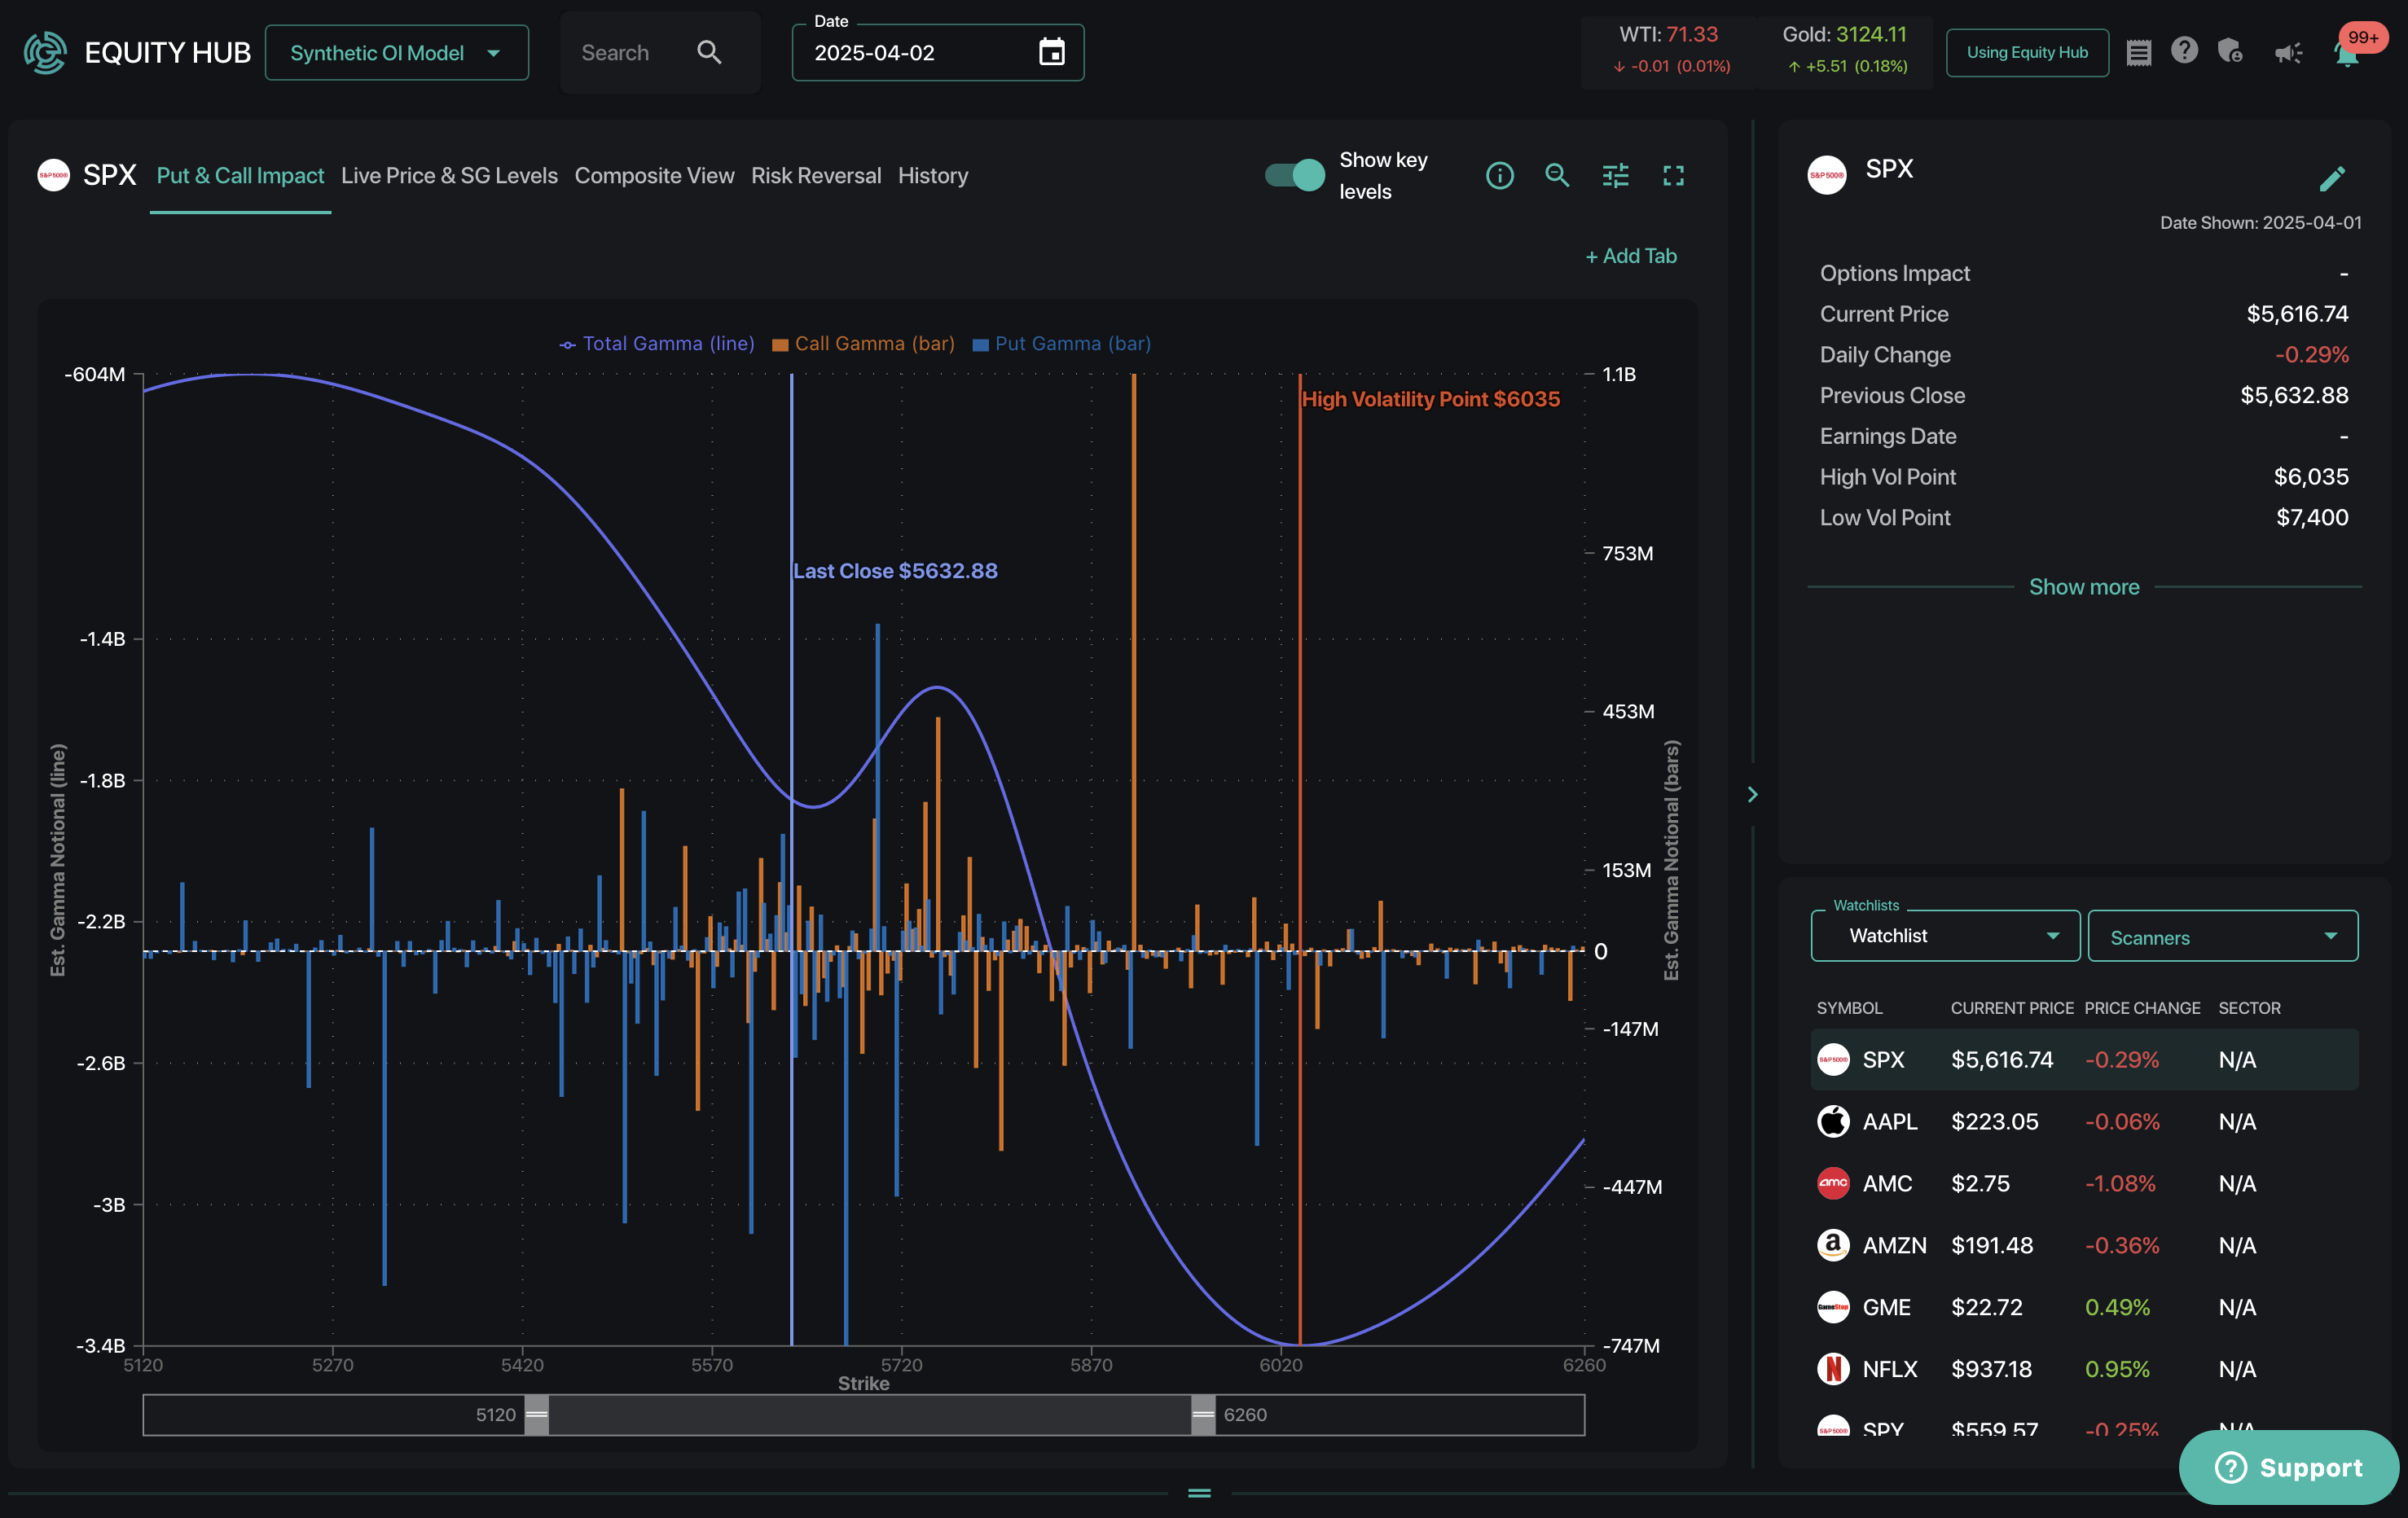
Equity Hub reveals how the options market influences 3,500+ US stocks, indices, and ETFs. Equipped with Total OI & Synthetic OI Lens, you can see where buying/selling pressure is building before it hits price. Learn just how significant the options complex is for each name, and quickly find support and resistance levels for the stocks you are watching. Build a personalized watchlist of names , view 10-day historical changes in key levels to spot trends, and utilize SpotGamma’s proprietary Volatility Risk Premium and Squeeze Scanners to find interesting names to trade.
assess market volatility & sentiment
Volatility Dashboard
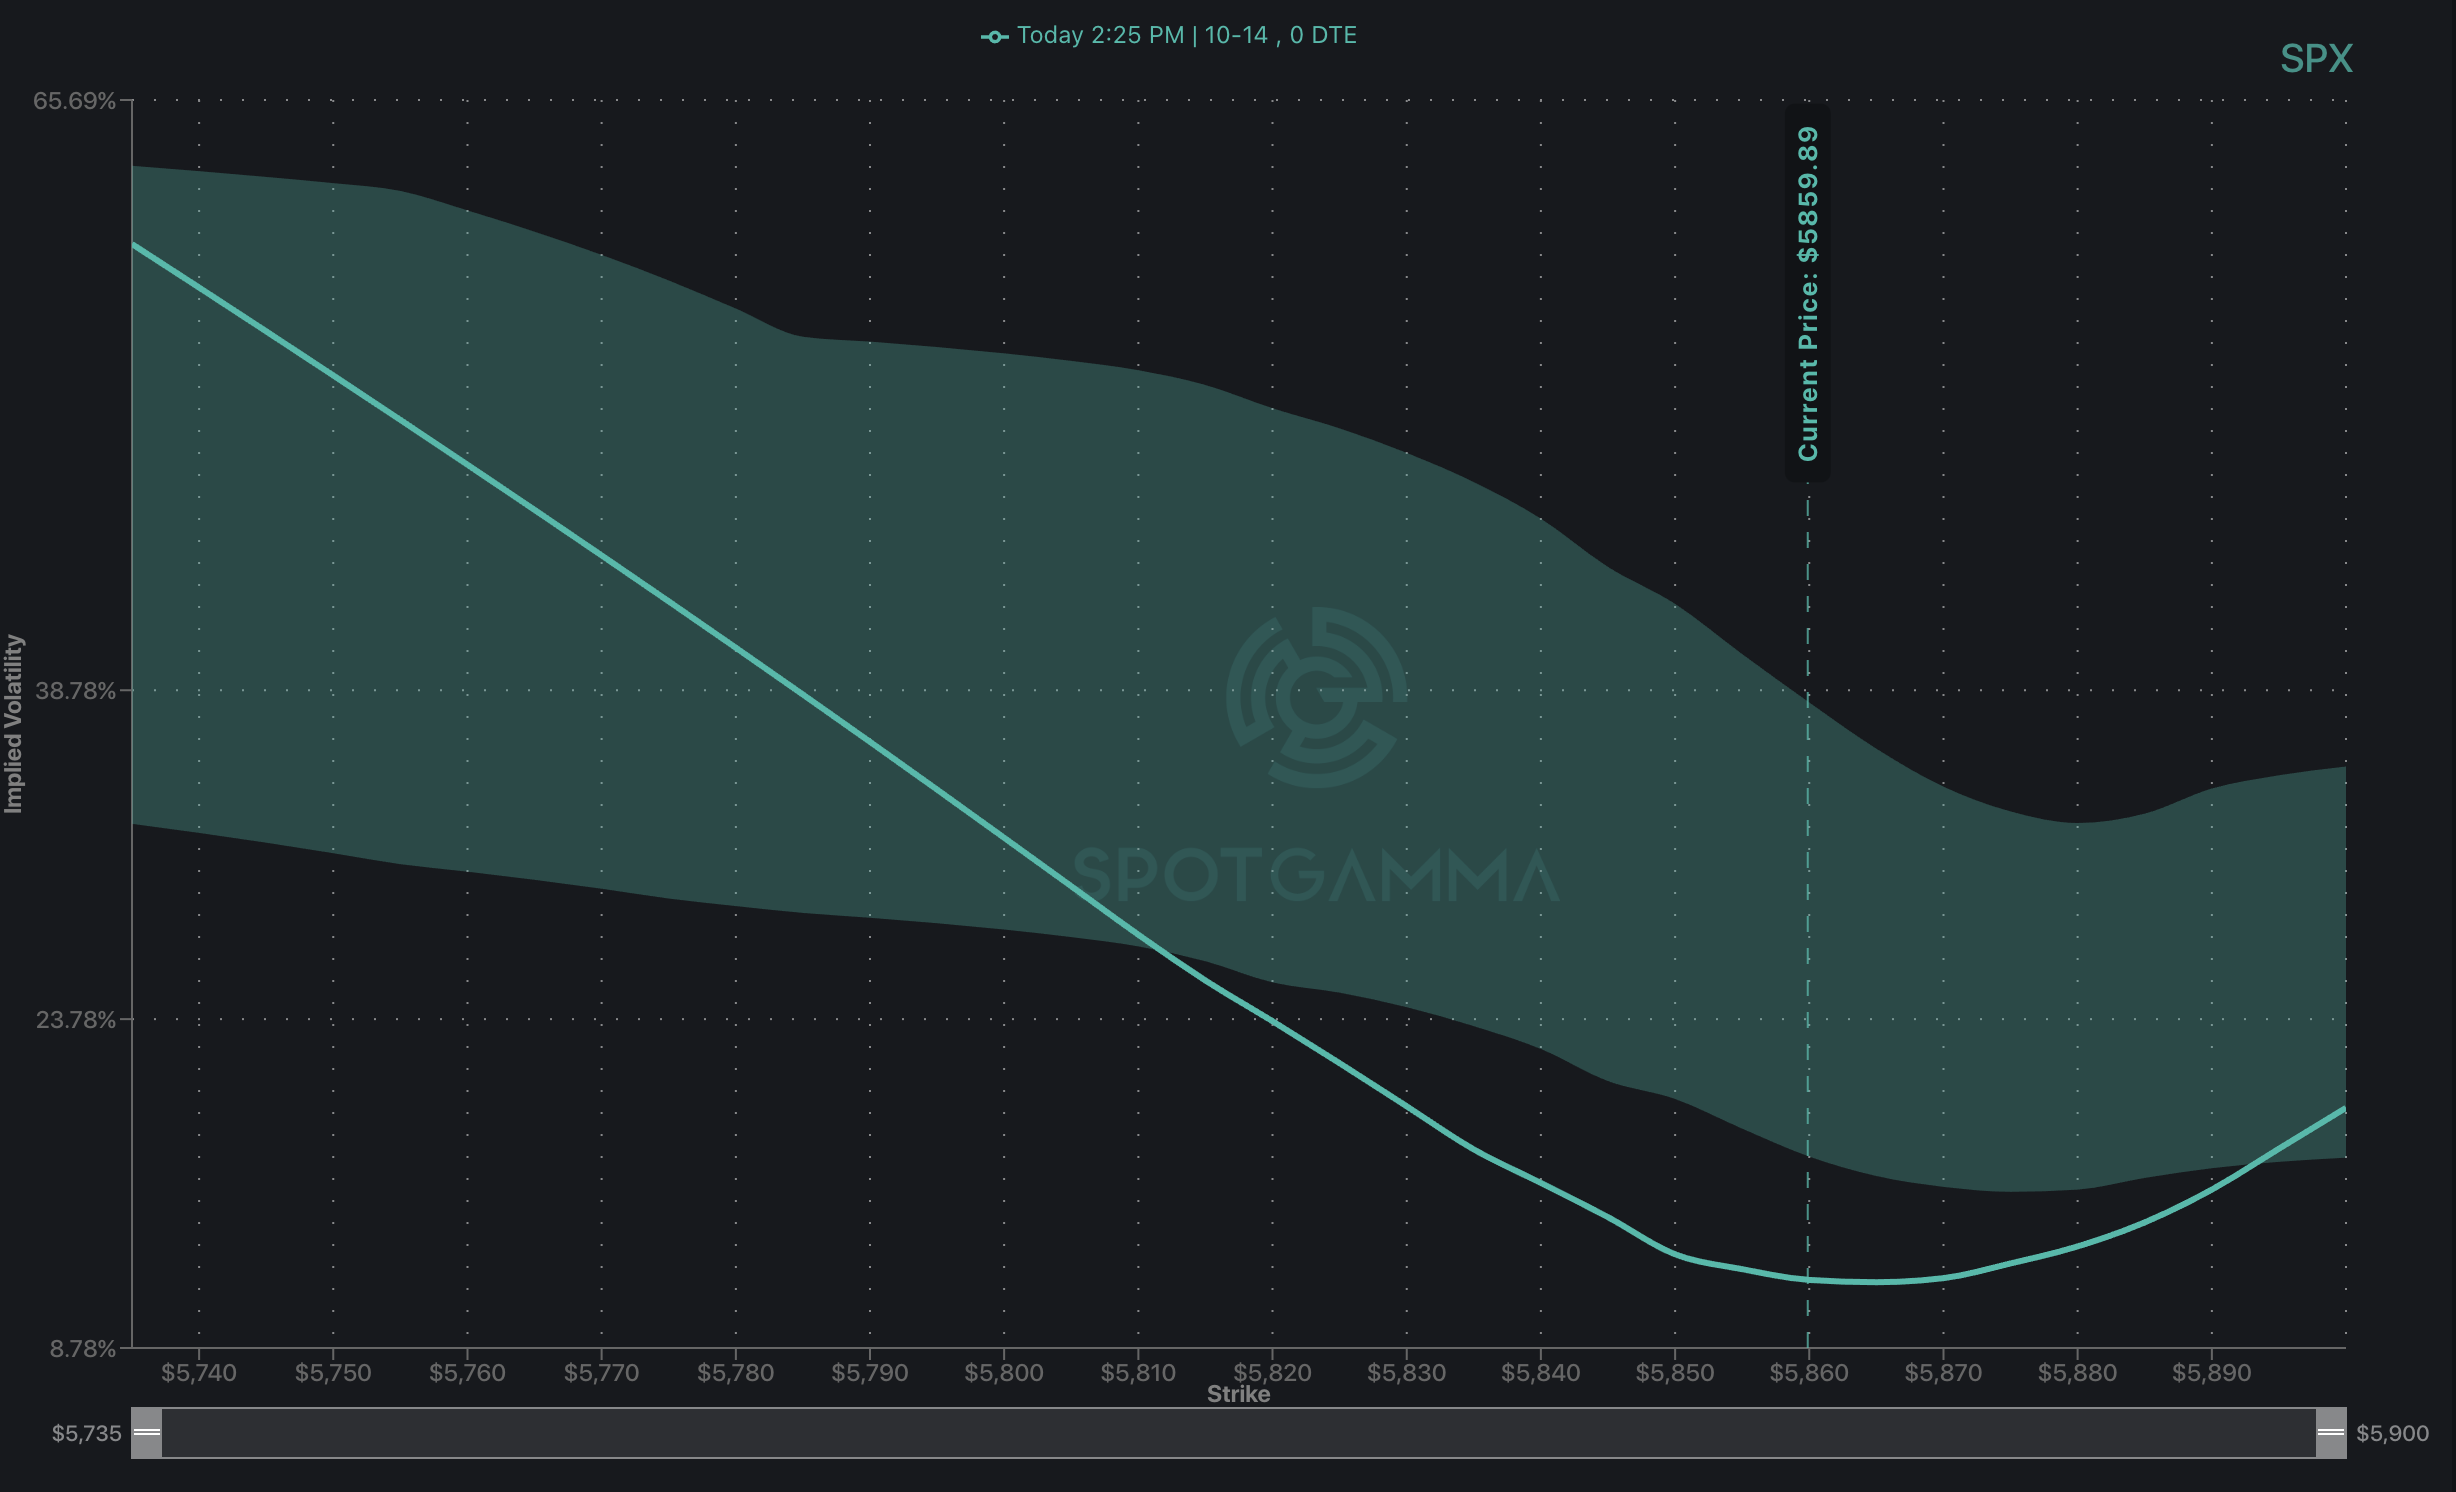
The SpotGamma Volatility Dashboard uses real-time data and SpotGamma’s proprietary algorithms to deliver a complete view into current market volatility. Implied volatility (IV) measures how much an ETF, stock or index is expected to fluctuate over a given time period, and it is a critically important metric for traders to track and understand. Within the Volatility Dashboard, the Fixed Strike Matrix provides a comprehensive look at volatility across all strikes and expirations for over 3,500 US stocks. The Term Structure tab shows how at-the-money IV changes over time, revealing the importance of key events and helping time options trades. With Volatility Skew, visualize whether expectations of volatility are more call- or put-driven, letting you know where market sentiment currently resides.
options flow tool
tape
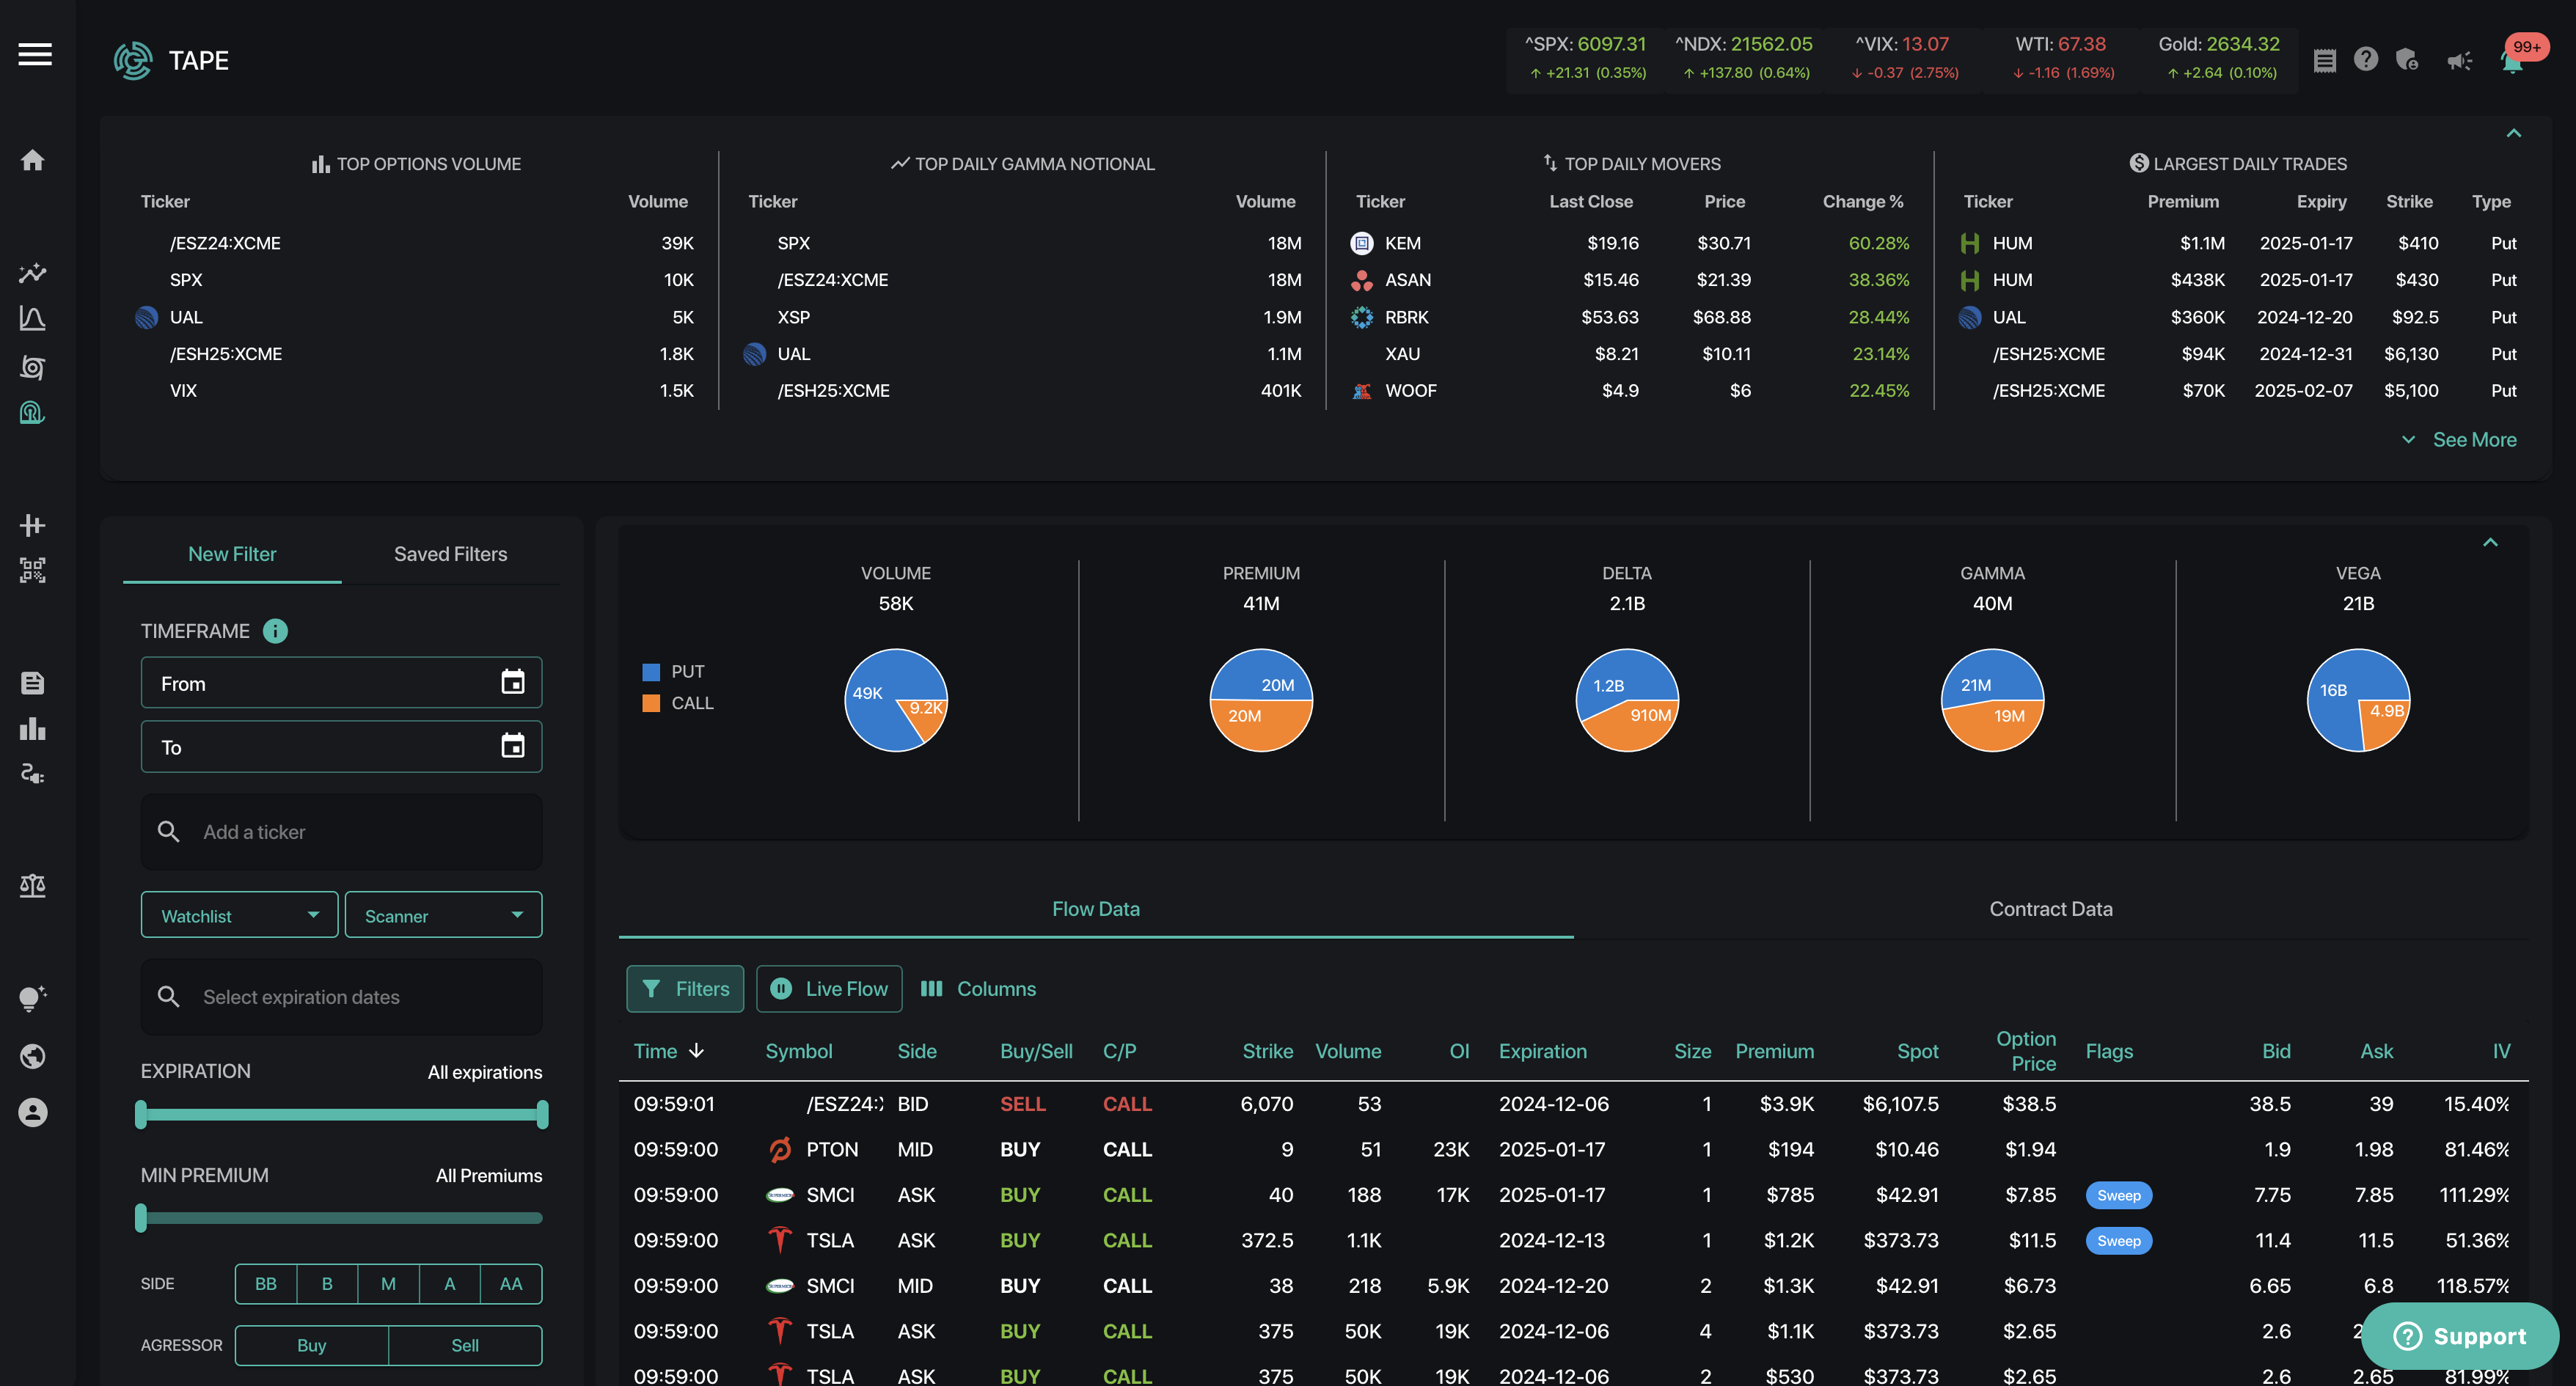
Tape is SpotGamma’s options flow tool which displays live trade details for US stocks. Encompassing over 3,000 tickers, Tape highlights high-volume activity and empowers you to scan through the noise to see trends and impactful trades. With actionable visualizations and customizable filters, both Flow Data and Contract Data can be paired with HIRO and other SpotGamma indicators to unveil the impact of options flows on underlying stocks.

