SpotGamma has released an update to three subscriber charts, providing enhanced interactivity for users.
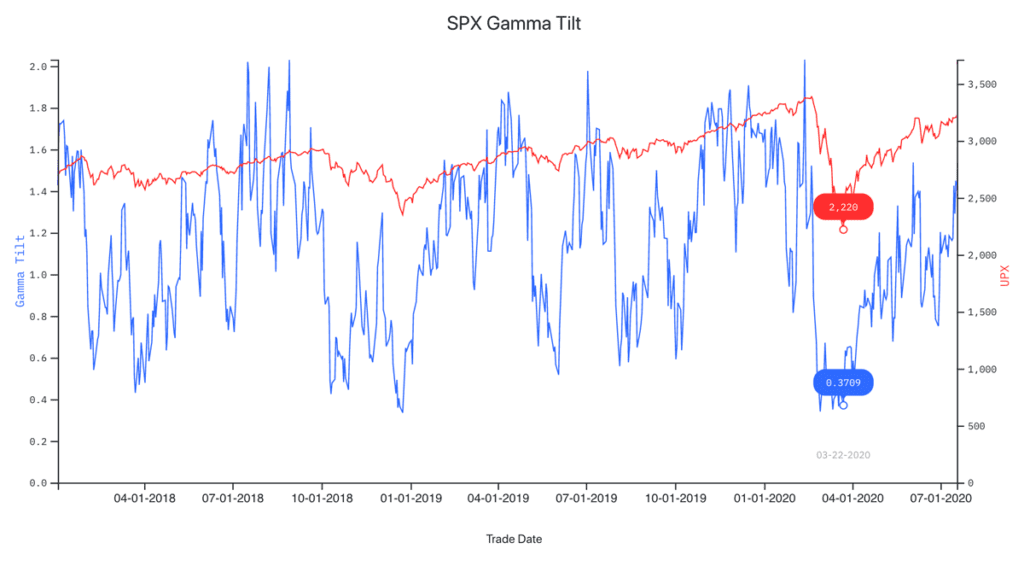
1. SPX Gamma Tilt Chart

You can now hover over individual dates to see actual levels for Gamma Tilt (the ratio of call gamma to put gamma) and UPX.
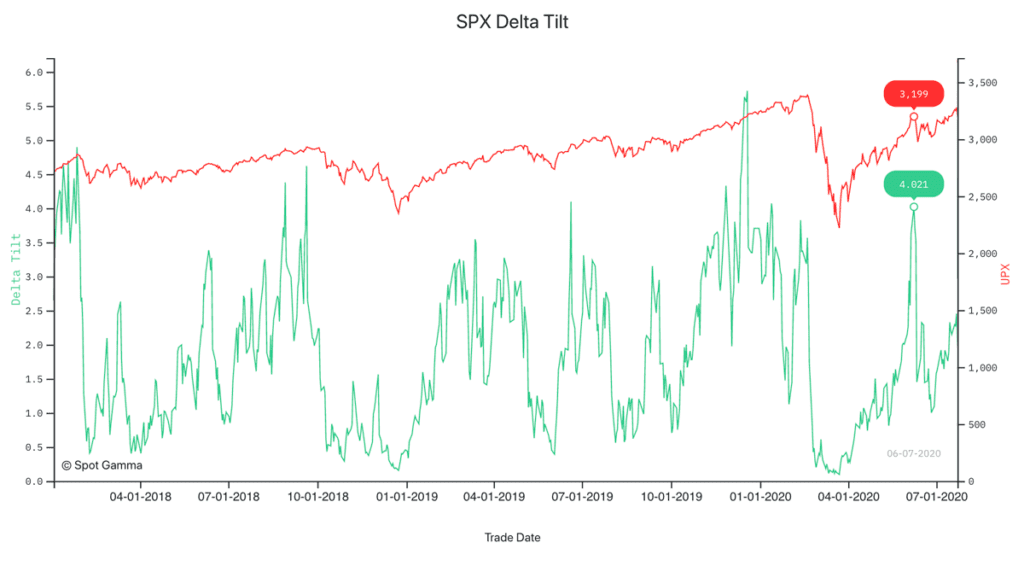
2. SPX Delta Tilt Chart

You can now hover over individual dates to see actual levels for Delta Tilt (the ratio of call delta to put delta) and UPX.
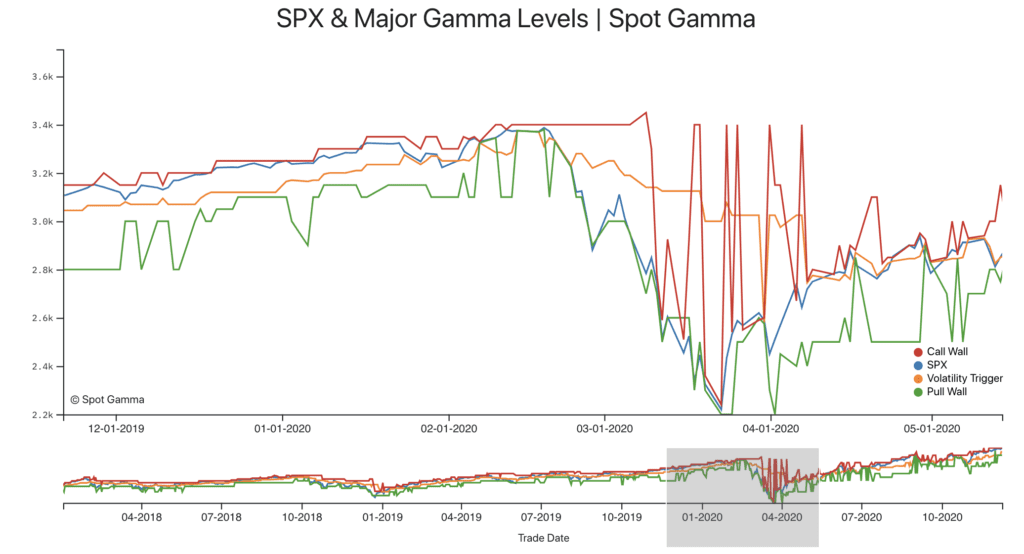
3. Historical SPX & Major Gamma Levels Chart

The historical chart highlights the S&P 500 vs. our key metrics: ZeroGamma, Call Wall & Put Wall. You can now see how the market responds to these various levels by zooming in using the bottom pane for specific timeframes and dates.
New to SpotGamma? Check out all our products today so you won’t get caught off guard when the market changes.
