As “dealer gamma” seems to becoming more prevalent there are more charts from various banks leaking out to the retail public. Here is a compilation of a few:
Nomura more or less matches ours, but they combine SPX and SPY into one chart whereas we prefer to keep them separate.

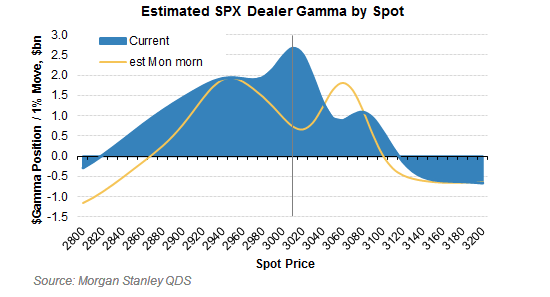
Morgans Stanley’s dealer gamma seems odd compared to both ours (SpotGamma) and Nomura. Notice not only is the “0” gamma point much lower for MS (~2800 vs ~2950) they also see ~$1bn gamma per 1% PERCENT move, while we see ~$1bn for a 1 POINT move.

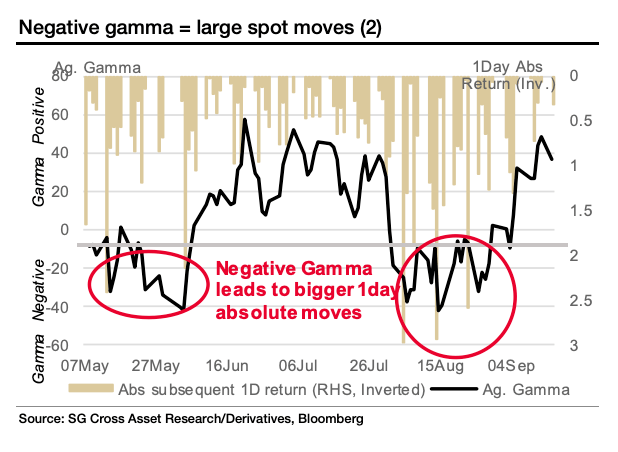
SocGen didnt have a chart similar to ours and Nomuras, but you can see they calculate current dealer gamma levesl around $60 billion, we’re assuming thats per PERCENT move.

Charts pulled from Heisenberg Report posts.
