Leopold Aschenbrenner’s Situational Awareness LP sold its entire public book — to Citadel, per the WSJ — after July’s AI infrastructure crash. The positions, the margin math, and what the unwind means for volatility and positioning.
Market Analysis
Big Tech Earnings and FOMC Collide
The Dispersion Unwind Arrives Last week, we noted in our pre-market Founder’s Note that markets were skating on thin ice. In addition to growing macro risks, COR1M had collapsed below 8 signaling extreme dispersion between index and single-stock volatility. After our Risk Pivot level was breached on Thursday, the growing negative gamma environment amplified the […]
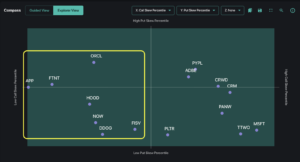
Space Stocks: Oversold Bounce or Ready for Liftoff?
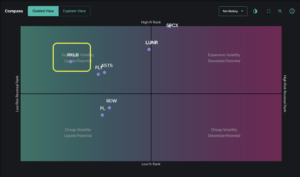
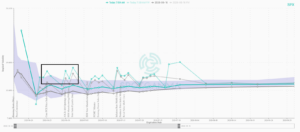
Last month, space stocks rocketed their way onto every trader’s radar. SpaceX’s record-breaking June IPO (SPCX) drew a wave of retail and institutional attention to the sector, while a string of NASA announcements made headline news and fueled several meaningful moves. Overall, the space sector has been defined by a notable downtrend in the past […]
Will the AI Unwind Finally Spill Over?
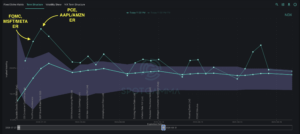
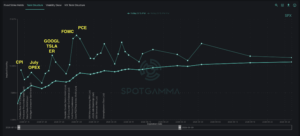
Last week delivered a string of constructive catalysts that supported the market through Thursday. Inflation ran cooler than expected, bank earnings impressed, retail sales beat, and ASML and TSM offered encouraging commentary towards semiconductor demand. While hostilities with Iran escalated, the market remained quite stable until Friday’s 1% drop following the Kimi-3 announcement. The stability […]
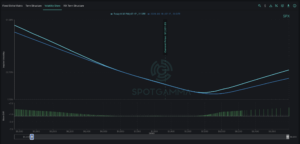
Volatility Approaches Record Lows — Is It Priced Too Cheap?
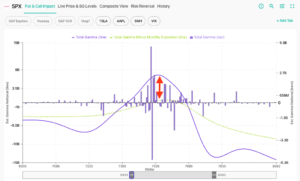
The S&P 500 spent early July grinding higher with sector rotation quietly forming beneath a calm index. As SPX price action remained relatively muted over the past week, implied volatility dropped to near-record lows as of Friday: IV for contracts expiring next week now sit in the 6-10% range. Regardless of any directional bias for […]
Why Nasdaq Volatility Is Breaking Away from the S&P 500
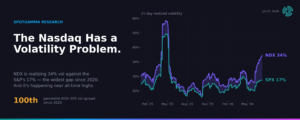
Key Takeaways We believe the options market is signaling something much larger than a temporary volatility anomaly. The Nasdaq itself has structurally changed in the past year, with its year-to-date performance +16% vs +9% for the S&P500. Concentration, AI exposure, new index methodology, and options positioning have transformed it into a meaningfully different investment than […]
Passing the Baton: From Semis to Software?
The AI trade has been the story of the first half of 2026, and semiconductors have been the main characters. The sector now accounts for roughly 20% of the entire S&P 500 — a historically high concentration. As we covered in our previous newsletter, any meaningful profit-taking in this area brings up the important question […]
July’s Setup: Rotation and Repositioning
June lived up to its reputation as a volatile month with last week’s market drawdown. As we turn the page into July, the market now appears to be recalibrating positioning. Recent turbulence has driven capital rotation out of crowded tech leadership, and we now look for opportunities in alternative pockets of the market. In our […]
Korean Options Mania: How AI, Retail Leverage, and Memory Stocks Turned South Korea Into the World’s Most Volatile Market
South Korea’s options trading mania in 2026 is driven by AI memory stocks, record retail leverage, ELWs, and extreme volatility in Samsung and SK Hynix. Here’s what’s fueling the surge and why it matters globally.
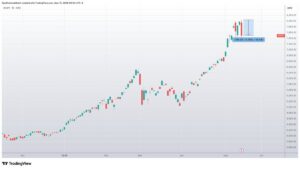
Vol Sellers Shrug off a Hawkish Fed
Despite a hawkish Fed rattling equities midweek, the market easily and quickly retraced any lost ground by Thursday. With June OPEX now behind us and implied volatility reset toward recent lows, there is a soft feeling of “what’s next?” for the S&P 500 until earnings season ramps up next month. The June FOMC meeting on […]
