S&P 500 Stock Market Gamma Trading Levels Based on Options Open Interest
Skew Rank + IV Rank Chart
Where options flow the markets go
Meet SpotGamma, where we use our proprietary options flow data to help you read and understand the patterns driving today's markets
Daily Options Flow Analysis
Unique Levels on US Indices
Real-Time Charts & Indicators
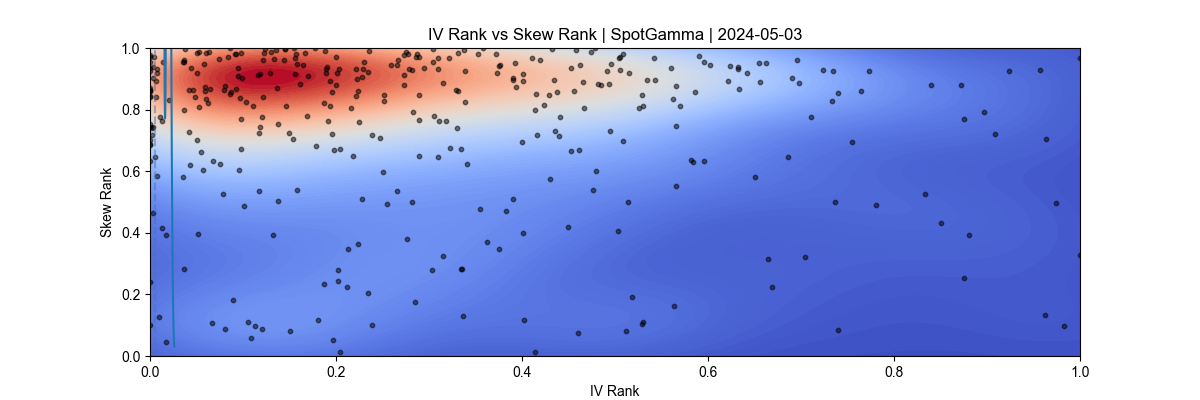
SpotGamma's Skew Rank & IV Rank Chart
The X & Y axis are measuring the percentile rank of IV (x axis) and skew (y axis) for stocks with the largest options volumes. The black data points mark the iv & skew rank for each stock.
The brighter shade of red on this chart shows the greatest concentration of stocks across SpotGamma's "skew rank" & "IV rank" metrics. This concentration informs us as to traders general positioning across the options landscape.
A concentration in the top left of the chart indicates a high bullish sentiment, often associated with strong stock returns. Stocks that are in the top right have bullish expectations into volatility-inducing event, like earnings.
Stocks in the bottom left may signal the onset of bearish positioning, which could appear into market peaks, like when traders are anticipating the start of a selloff. Lastly, a concentration in the bottom right of the chart indicates traders are fearful of downside movement across stocks.
Options skew ranking and implied volatility (IV) ranking are critical metrics for traders, offering deep insights into the options market's expectations and sentiment. The IV rank measures how current implied volatility compares to its historical levels, providing traders with a gauge of whether options are relatively cheap or expensive. A higher IV rank might indicate heightened market uncertainty or expectations of significant price movements, potentially signaling more expensive options premiums.
Skew ranking, on the other hand, assesses the asymmetry in the implied volatility across different strike prices for the same expiry. This skew can indicate traders' perception of the risk of significant downside versus upside movements. A higher skew ranking suggests that there is a greater expectation of downside risk, as reflected in the higher implied volatility for out-of-the-money put options compared to call options.
The #1 secret for navigating the waters of today’s financial world is understanding volatility
Join SpotGamma March 5 - 8, 2024 for 4 days of in-depth exploration into volatility, where traders of stocks, options, and futures will learn to track, assess, and trade with precision.
Access today's Founder's Note for FREE!
Expert commentary packed with proprietary key levels, major support and resistance targets, and market analysis.
By subscribing, you agree with our Privacy Policy and provide consent to receive updates from our company.
Understanding these metrics allows traders to make more informed decisions, particularly in strategies that involve premium selling or buying, hedging, or speculation on market direction. By analyzing IV and skew rankings, traders can identify potential trading opportunities, gauge market sentiment, and manage risk more effectively.
Want More HIRO Indicator Charts?
With SpotGamma Alpha, see over 200+ symbols and indices - in real time
Want More HIRO Indicator Charts?
With SpotGamma Alpha, see over 200 symbols and indices - in real time
Why is Skew Crucial for Traders?
Options skew, often referred to as volatility skew, is a critical concept in the financial markets that describes the variation in implied volatility (IV) across options with different strike prices but the same expiration date. This phenomenon occurs when the market's expectation of volatility differs for options that are in-the-money, at-the-money, or out-of-the-money.
Typically, options skew reflects the market's perception of risk, showing a higher implied volatility for out-of-the-money (OTM) options compared to at-the-money, or ATM options. The relative pricing can indicate greater fear or anticipation of either downside or upside stock movements.
Understanding options skew is essential for traders and investors as it provides valuable insights into market sentiment, potential price direction, and hedging strategies. By analyzing the skew, traders can better assess the cost of options, identify arbitrage opportunities, and tailor their trading strategies to exploit perceived market inefficiencies. For anyone looking to deepen their options trading knowledge, grasping the intricacies of options skew is a fundamental step towards mastering market dynamics and enhancing trading performance.
Try SpotGamma's New Volatility Tools for Free
Supercharge your trading strategy with expert analysis, proprietary levels, and real-time tools


