S&P 500 Stock Market Gamma Trading Levels Based on Options Open Interest
HIRO Indicator
See options activity in real time
Enabling traders to detect possible hedging flows tied to options trades and to anticipate their impact
See options trades impact the markets down to the second
AS SEEN IN:
HIRO Indicator Case Studies
Index Trading Example - SPY
January 24th, 2022
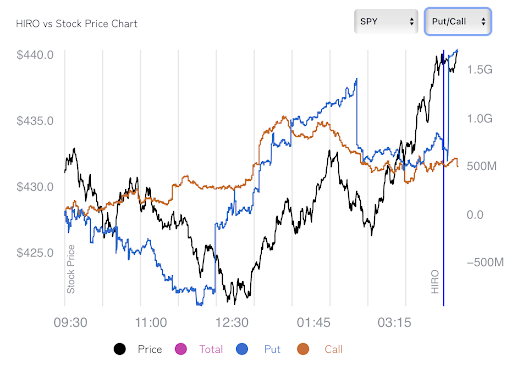
On January 24th, the stock market was down sharply, with the S&P500 (SPY ETF) being down nearly 4% near mid-session (black line, below). It was at that time that the HIRO Indicator started to register large levels of put selling (blue line, below) in the SPY ETF.
Initially this started as one large trade, taking place near 12:30 ET, with a cumulative wave of smaller put sales continuing unabated into the afternoon.
It is just after these put sales begin at 12:30 ET that the SPY ETF makes its intraday low, and subsequently rallies nearly 4% into the close.
We believe that these put sales allow options dealers to close short hedges, which results in buying pressure in markets. The more put sales there are, the more hedges (ie. stock) that dealers must buy.
SpotGamma documented this session just after the close on 1/24, viewable here.
Stock Trading Example - CLOV
January 31st, 2022
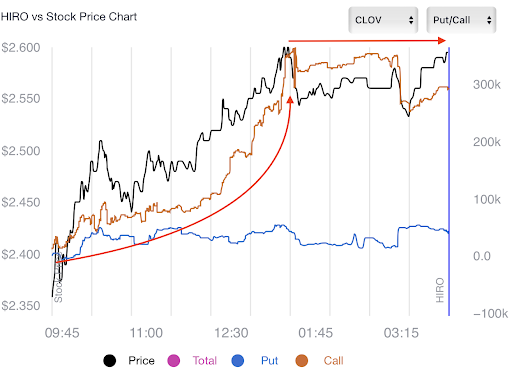
CLOV, a speculative “meme stock” was up over 11% on the day, boosted by strong call options buying (orange line).
Note that the stock had a straight path higher, until the call options volume stopped - it was a this point that the stock stopped shifting higher, too.
Track large options trades, anticipate hedging pressures and gauge sentiment
Cumulative Indicator
By calculating the estimated deltas required to hedge trades, you can measure the hedge impact of all options trades taking place in real time
Strength of Signal
Watch the real-time HIRO signal plotted on a 5-day & 30-day gauge detailing the upper and lower bounds of the HIRO signal for any given stock
Powerful Filters
Change what you see about the stock: All Trades, Next Expiry, Retail, Total View of Delta hedging pressure or broken out by Calls and Puts, separately
Trending
See stocks identified by SpotGamma's proprietary algorithm currently experiencing massive activity relative to a stock's immediate movement
"Today, I did my first trade solely based on HIRO. I executed via some short-dated puts that multiplied in value. I’ve been singing your praises for a while, but this takes it to a whole new level."
- Alan I., SpotGamma Alpha Subscriber
Subscribe Now!
Access to HIRO is exclusively reserved for SpotGamma Alpha subscribers
SpotGamma Alpha provides subscribers with exclusive access to the all new HIRO interface, with monthly and annual subscriptions are available. PLUS! You'll receive our AM and PM Founder’s Notes and get access to Equity Hub analysis across 3,500+ stocks and indices.
secure order form
Billed Monthly
Billed Annually (Save 25%)
Pay every month.
Pay upfront for the whole year.


