• Skip to main content
  • Skip to primary sidebar

SpotGamma™

S&P 500 Stock Market Gamma Trading Levels Based on Options Open Interest

  • About
  • Pricing
  • Academy
  • Resources
    • Tool Demos
    • Case Studies
    • Blog
    • Support Center
    • Free Daily Report
    • Free Trading Tools
      • Options Profit Calculator
      • SPX Gamma Exposure
      • Implied Earnings Moves
      • Volatility Ranking
    • Free Training
    • Report Card
  • Login

Apr 05 2021

SPX Options Vanna Into the April Rally

The S&P500 has been surging the last several days, following several large options expirations at the end of March.

With this we have seen a change in the forecast of our vanna model, which we use to forecast dealer buying or selling pressure. Vanna is the change in an options delta for a change in implied volatility (IV). Our model adjusts both the S&P500 price and implied volatility to forecast the directional exposure of options dealers.

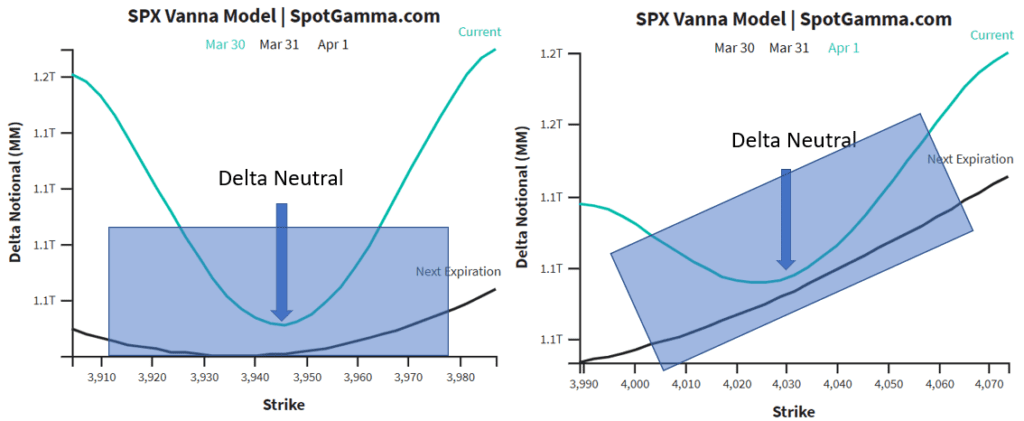
What’s plotted in our charts below is the notional exposure generated by the options position, and so in theory dealers will need to offset this exposure with ES futures hedges. We assume that dealers are “delta neutral” ie fully hedged at the start of each day, which is depicted with the blue arrow. As markets shift higher or lower dealers will need to adjust ES hedges accordingly.

As you can see in the figures, on March 30th (left) the dealers had a more or less neutral position for a given change higher or lower in the S&P. This is implied by the symmetrical nature of both the current (teal line) and future (black) delta exposure.

However, as the market ripped higher the estimated options exposure became much more skewed to long long side (April1 chart, right). In other words, the dealers options portfolio hypothetically gained much more long exposure. This is why both the current and future (next expiration) lines rise as we move to the right (higher SPX prices).

The implication here is that dealers will have to increasingly sell ES futures into these rising markets so that they can hedge this growing long options delta exposure.
We do not think this is enough of a force to cause a selloff in equity markets, but it does imply resistance is building around current S&P prices. Its important to note that this model is just one piece of our complete framework which includes factors like large options positioning and gamma adjustments.

Share This Article

  • Share
  • Twitter
  • LinkedIn
  • Reddit
  • Facebook

Written by developer · Categorized: Market Analysis, Stock · Tagged: Options Vanna

Don’t have an account with SpotGamma?

Choose the plan you want today to view unique support and resistance levels, access Founder’s Notes and expert commentary, daily trading ranges, and entrance into our private Discord.


Primary Sidebar

Related Resources

  • Welcome to the Summer Melt-Up

    Welcome to the Summer Melt-Up

    August 9, 2026
  • The Machine Ran on Call Skew: What MSTR’s Dead Volatility Surface Says About Strategy — and Bitcoin’s Missing Bid

    The Machine Ran on Call Skew: What MSTR’s Dead Volatility Surface Says About Strategy — and Bitcoin’s Missing Bid

    August 3, 2026
  • The New Normal in Volatility Takes Shape

    The New Normal in Volatility Takes Shape

    August 2, 2026
  • Anatomy of a Margin Call: How Situational Awareness LP Unwound a $20 Billion AI Book in One Trade

    Anatomy of a Margin Call: How Situational Awareness LP Unwound a $20 Billion AI Book in One Trade

    July 30, 2026
  • Big Tech Earnings and FOMC Collide

    Big Tech Earnings and FOMC Collide

    July 26, 2026
  • youtube
  • x
  • Privacy Policy
  • Disclaimer
  • Terms & Conditions
  • Support Center
  • Media
  • Contact Us

©2026 TenTen Capital LLC DBA SpotGamma

All SpotGamma materials, information, and presentations are for educational purposes only and should not be considered specific investment advice nor recommendations. Futures, foreign currency and options trading contains substantial risk and is not for every investor. An investor could potentially lose all or more than the initial investment. Risk capital is money that can be lost without jeopardizing one's financial security or lifestyle. Only risk capital should be used for trading and only those with sufficient risk capital should consider trading. Past performance is not necessarily indicative of future results. Testimonials appearing on this website may not be representative of other clients or customers and is not a guarantee of future performance or success.

View Full Risk Disclosure