TL;DR: SpotGamma believes that there will be many periods of high call buying as traders protect against missing market rallies.
2023 will be the year that the VIX index shifts from being known primarily as a “fear indicator” to the “fear of missing out indicator.” This is because traders will be increasingly concerned about missing a significant market rally, which may result in spurts of heavy call buying. This heavy call buying can, over short periods, drive the VIX higher.
These ideas have been discussed in several of our Founder’s Notes, here.
2022 was a fascinating year in markets, particularly from the perspective of options volatility. The most well known measure of volatility is the VIX index, historically known as the “Fear gauge” because it tends to spike when stock markets are crashing. The reason for this, is that in tumultuous times traders will often seek out put protection. As more traders purchase put options, it increases the price of the VIX.
However, an interesting thing happened last year: The VIX had an intraday high of 39 on January 24, 2022, and never made a new intraday high despite escalating geopolitical tensions, a record increase in rates, a commodity crisis, and the S&P500 trading 11% lower.
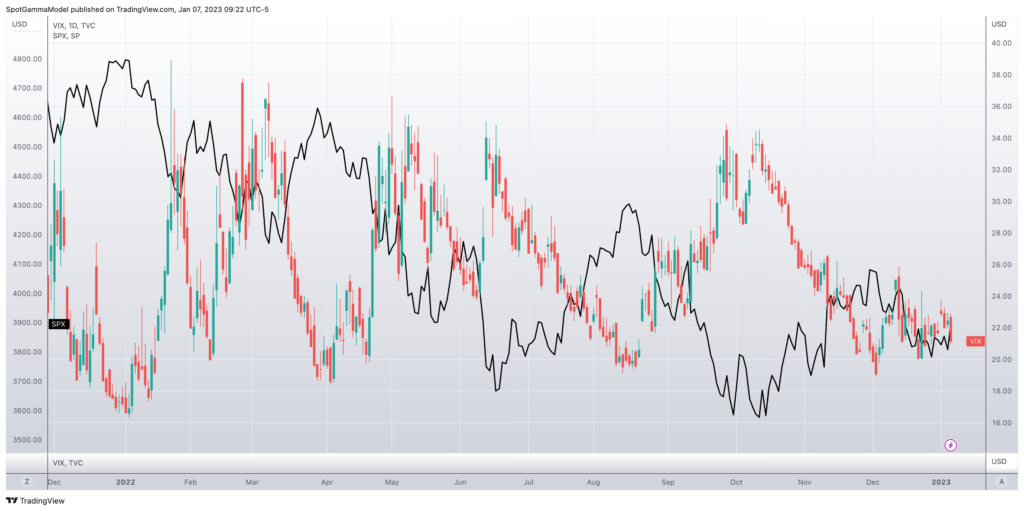
There are several theories as to why the VIX failed to make new highs despite deteriorating conditions. We believe that the main driver was a lower need for puts. Rather than seeking hedges for equity portfolios, investors simply chose to reduce their equity allocation. This reduced the need for large stock hedges via put options and/or VIX calls.
Why Does the VIX Matter
The VIX is based on the prices of options on the S&P 500 index. When investors are more uncertain about the future of the stock market, they tend to buy more options as a way to protect their portfolios. As a result, the prices of options rise, and the VIX increases. Conversely, when investors are more confident about the market, they tend to buy fewer options, and the VIX falls.
The VIX is calculated using a complex formula that takes into account the prices of both call and put options on the S&P 500 index. It is expressed as a percentage, and it is typically quoted in annualized terms. For example, a VIX reading of 20% means that the market is expecting the S&P 500 to move up or down by an average of 20% over the next year.
The VIX is based on the prices of options on the S&P 500 index. Specifically, it is calculated using the prices of options on the SPX Index, expiring within 30 days. The CBOE calculates the VIX using a formula that takes into account the prices of both call options and put options on the S&P 500 index.
To calculate the VIX, the CBOE first determines the implied volatilities of a wide range of call and put options on the S&P 500 index with different strike prices and expiration dates. Implied volatility is a measure of the expected volatility of a security’s price over a given time period, as implied by the current price of options on that security.
Next, the CBOE takes the weighted average of the implied volatilities of the options to arrive at a single number that represents the expected volatility of the S&P 500 index over the next 30 days. This number is then annualized, meaning it is expressed as a percentage and scaled up to represent the expected volatility over a full year.
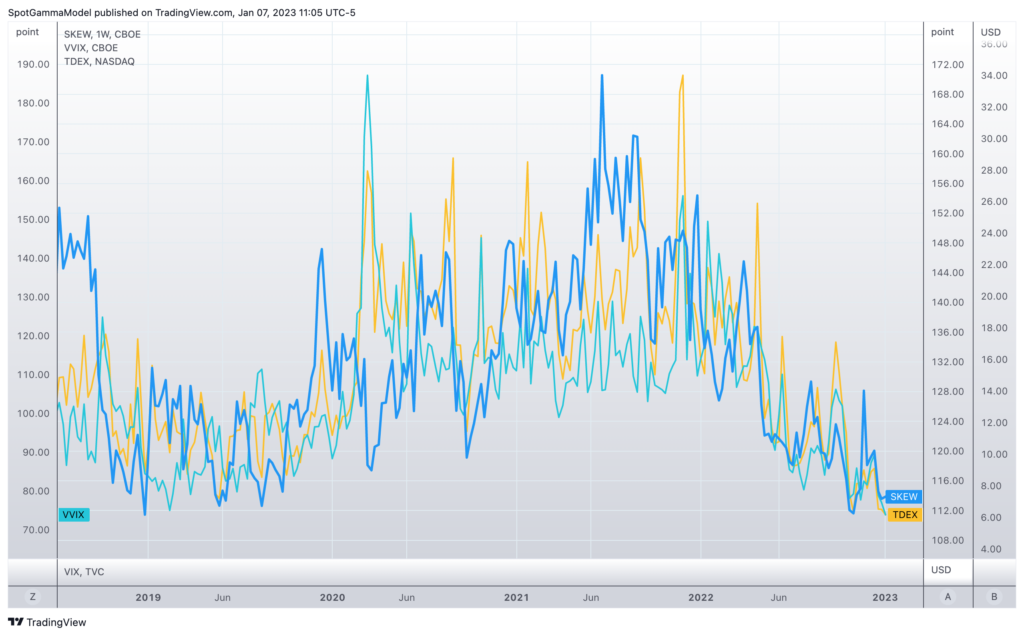
Evidence of Low Put Demand
The lack of demand for downside hedges is also evident in skew based volatility indicies like the VVIX & SKEW. Each of these indices price the value of a put option vs the value of a call option. As demand for the puts decrease relative to calls.
Traders Rotating Their Equity Exposure
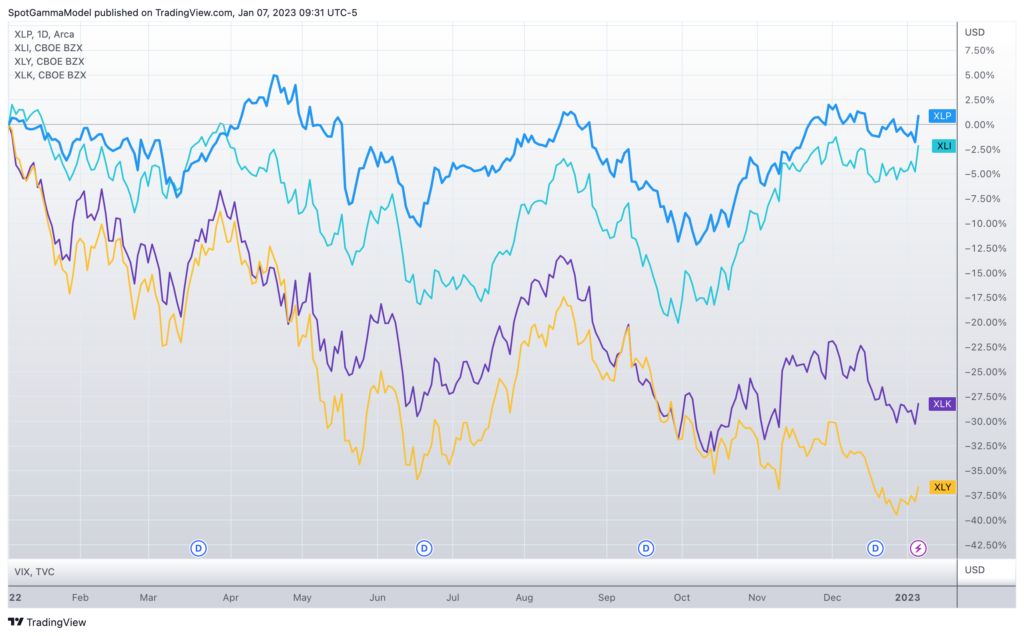
The other interesting feature of the 2022 equity market selloff what that it hit different sectors disproportionally. This was particularly true into Q4, and suggested that traders were not simply trying to sell of their equity postions writ-large, but instead allocating out of more interest rate sensitive sectors like tech, and into stocks which may benefit from this evolving economic environment (ex: healthcare, high dividend paying stocks).
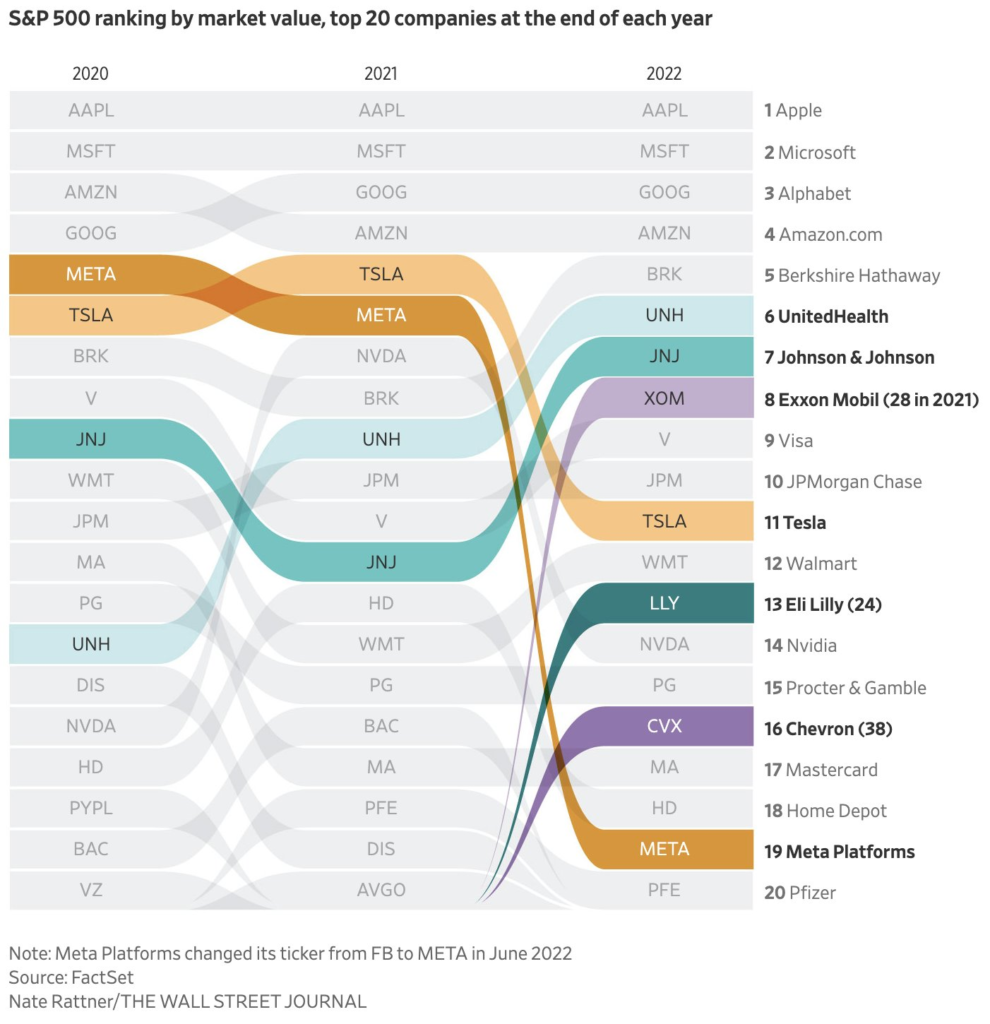
This impact can also be seen in the shuffle amongst top constituents in the S&P500. While the top S&P stocks have recently been dominated by tech names, we are now seeing a more broad diversification of names enter the top slots.
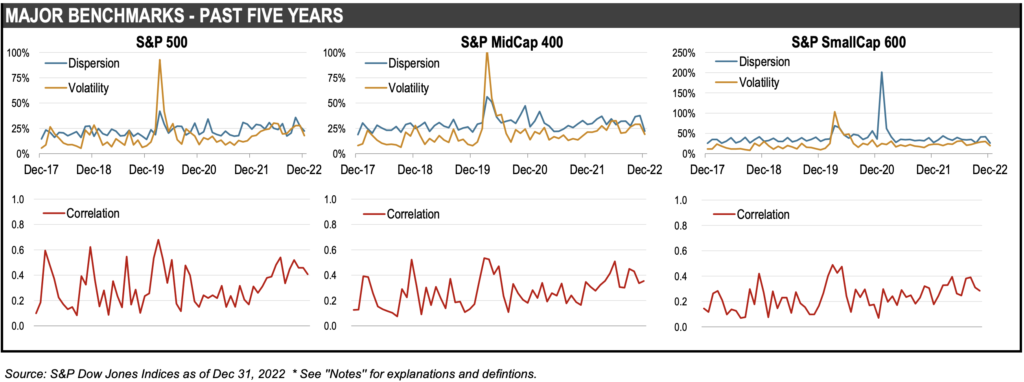
As noted above, during times of great fear and uncertainty traders may sell all of their equities. These selloffs result in stocks having highly correlated movement – wherein correlation moves to 1, detecting that all stocks are moving in tandem.
In this case, it appears that correlation (bottom row) is moving down as equities had a weak 4th quarter. This further supports the notion that selling is more due to cash rotating amongst equities, and not out of equities.
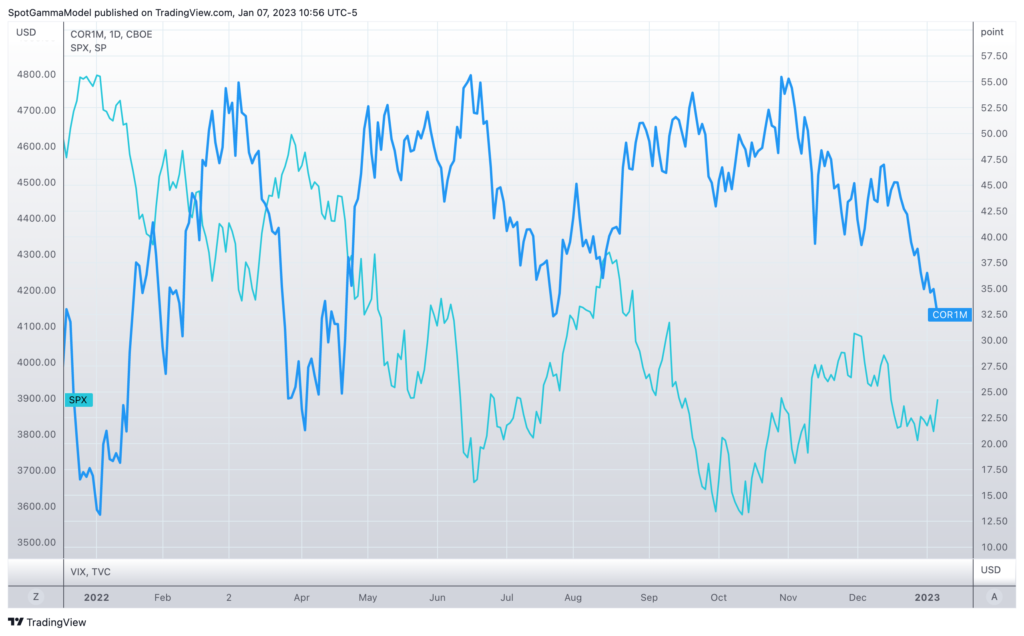
Another way to look at equity flows is through the CBOE 1 month correlation index. Implied Correlation Indexes offers insight into the relative cost of SPX options compared to the price of options on individual stocks that comprise the S&P 500.
The Right Tail Chase
While not all stocks are participating equally during downside movement, upside movement may be a different story. SpotGamma, like many bank analysts, believe that there is a great deal of investor concern with respect to missing a significant stock rally. This can often occur in situations wherein traders may feel that they are underallocated with respect to equities, after periods of prolonged declines.
This threat of missing stock market upside is often referred to as “right tail risk”, whereas “left tail risk” is that of a large market crash.

Arguably the most efficient way to protect against right tail risk is to purchase call options, which may provide a leveraged upside return with a fixed risk profile. When call demand is strong enough in the SPX index, it can result in moving the VIX higher.
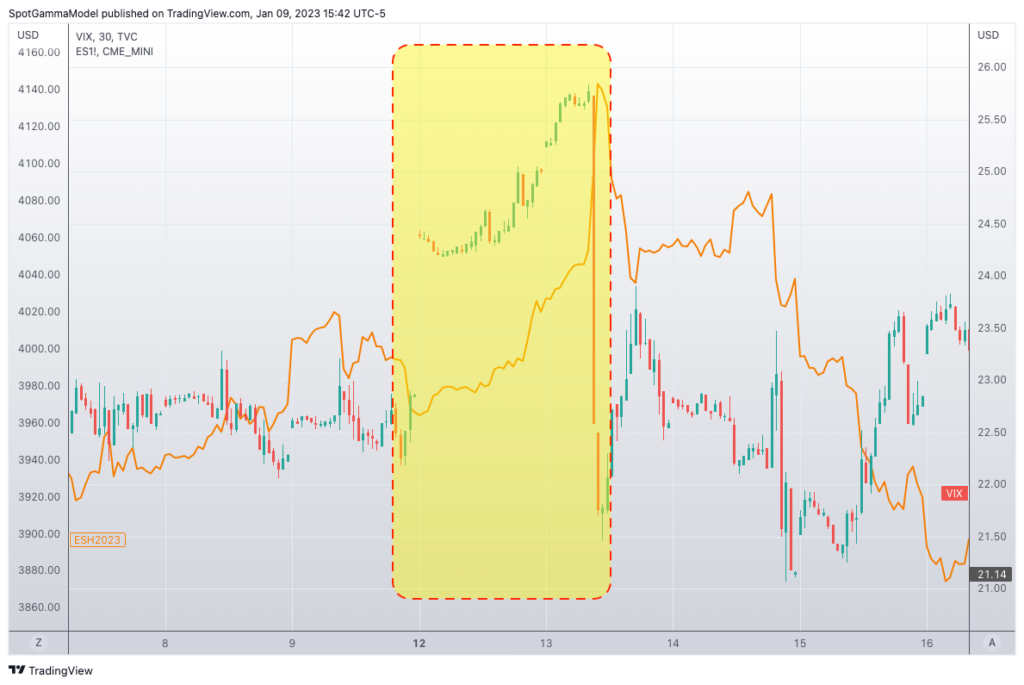
We have seen several instances of this behavior in 2022, and none more prevalent than into the December 13th CPI data release. Heading into the morning of December 13th, the SPX climbed over 2.5% while the VIX added 3 points (13%). This, after several banks predicted a large bullish response to the CPI, likely leading many to hedge upside risk with long call positions.
Further, we believe that stock rallies will be associated with high levels of correlation, and high levels of correlation are often associated with high levels of volatility. This is because all stocks often move higher during bear market rallies, with the strongest moves coming in the weakest, most shorted stocks.
Consider moves like those of November 10th, wherein the S&P rose 5.4% off of CPI data:
“Tech stocks that have been hardest hit by the rise in inflation and surging interest rates led the gains Thursday. Shares of Amazon were up about 12.2%. Apple and Microsoft each advanced more than 8%. Shares of Meta rallied more than 10%. Tesla jumped 7%.”
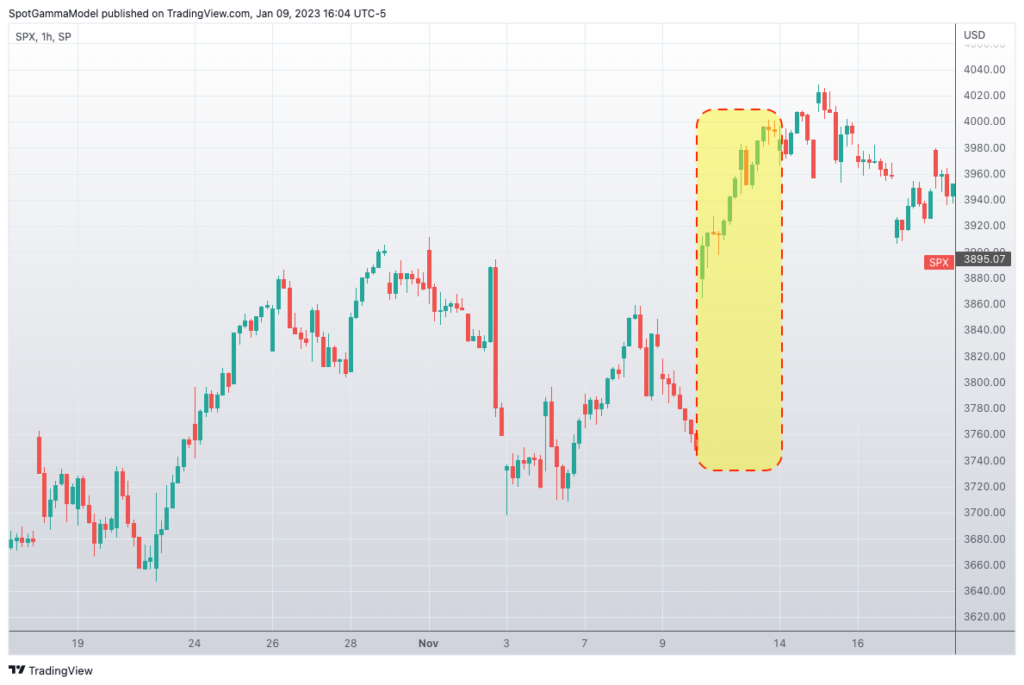
When volatility expresses itself in higher stocks, it can serve to increase call values, which could further drive the VIX higher.
Consider this, from Bloomberg*: “While the S&P 500 saw far fewer up days than is normal in 2022, when the index did manage to rebound, it did so violently. Rising a median 1.15%, the index’s increase on positive sessions was the largest since 1938.”
*Source: (BN) Biggest Ever Bear-Market Bounces Create Unending Pain for Shorts – Lu Wang
