There was an interesting twitter thread yesterday which correctly pointed out the very large contango in the VIX futures market. Specifically we had the VIX index trading nearly 4 points below that of the front month VIX future [VX1]. Currently the VIX is trading near 15, and that future is near 19. According to the thread: “…that spread has been wider only 14 times since 2004.”.
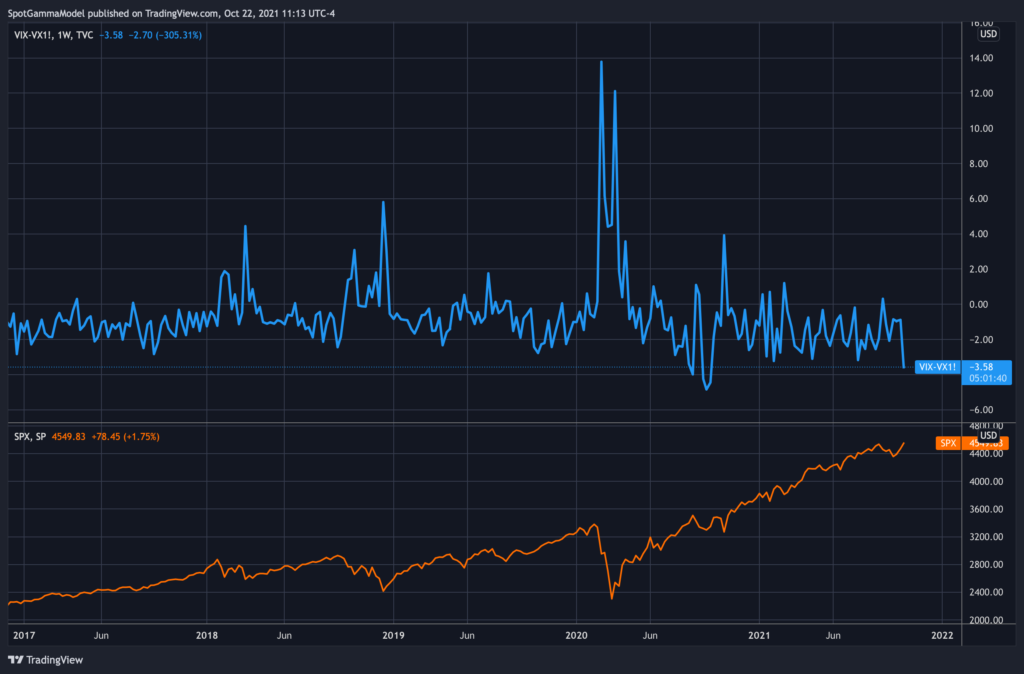
Here we have plotted the spread between the VIX – VX1, and you can see that in the last 5 years we’ve only have 2 instances of a spread this large, and that was in September of ’20. This came right after the market was down ~10% over 2 weeks. This spread could close in one of two ways: either VIX moves up or the VX1 moves lower. Historically it seems that this spread seems to occur after large market selloffs in which the VIX drops much more quickly than the VX1 future.
Not only is there a bit gap between the VIX Index and the front month future, but the entire VIX futures curve is very steep – that is longer dated futures are trading at very elevated prices. You can see this in the chart below, and we’ve included a snapshot of the VIX futures curve from the same day (10/22) but of 2019. You can obviously see that todays curve (black) is much more elevated across all expirations, but that also the spread between front month (ie 30 days to expiation) and longer dated is much higher.

Whats interesting here is that the VIX futures are tied to the VIX index. That is to say that the VIX future settles at the VIX Index level on expiration date. So the fact that there is a 4 point spread between the current VIX Index and the VX1. The VIX has been trading down sharply the last severl days, and the prevailing line of thought is that the VIX futures need to trade lower in order to “catch down” to the current VIX index.
