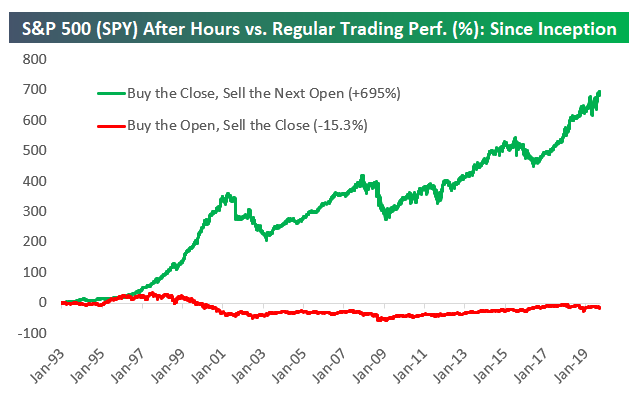
There is well knows research which shows that the overnight session in ES/SPX is the source of most of the positive market performance. This chart from Bespoke does a great job highlighting this.

We have thought a lot about this, and had a theory that this out-performance may be due in part to options hedging activity. Our thesis being that when the options market is not open options dealers are not as active in hedging. As much of the last 10 years has been a bull market featuring positive gamma, these dealers may be “capping” SPX performance as they sell into strength and buy dips. Conversely during markets with negative gamma dealers would be expanding price distribution as they hedge with market direction (sell as market goes lower, buy as it moves higher).
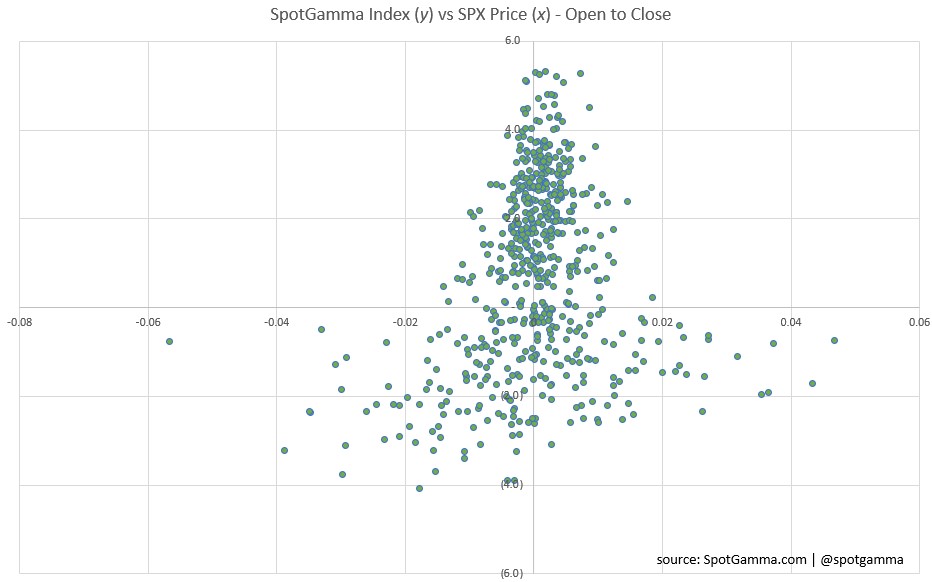
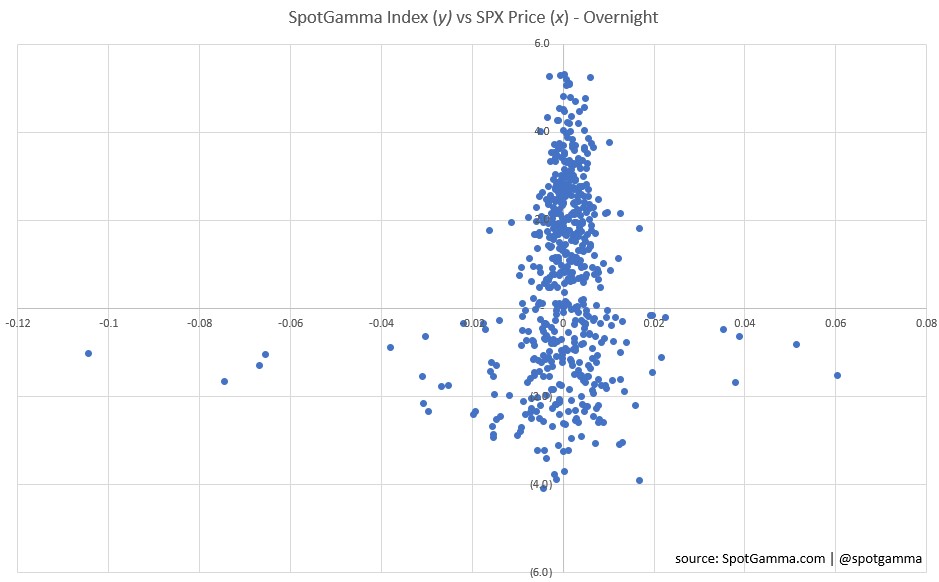
Comparing gamma levels vs SPX movement going back to January 2018 revealed some interesting data. The charts below display the gamma vs SPX return for the regular session (top) and overnight session (bottom).
You can see that the two sessions exhibit relatively similar SPX distributions for positive and negative gamma regimes. Surprisingly there seems to be a lot more price volatility during regular trading hours, but it seems most pronounced during negative gamma environments.


While the higher volatility during negative gamma environments would match our theory, the higher volatility during positive gamma regimes does not. The fact that the general distributions match suggests some linking force may be at play, but we did find it surprising that price distribution for the overnight session was tighter regardless of gamma level.
We also found it notable that the there was no move greater than ±2% for either session during a positive gamma period.
