S&P 500 Stock Market Gamma Trading Levels Based on Options Open Interest
How real-time options flow from the SpotGamma HIRO Indicator can help 0DTE traders
Try SpotGamma HIRO Indicator for Free
Real-time options data
See when options drive stocks
0DTE filter for short-term trades
How 0DTE Flow Can Move Markets
The SpotGamma HIRO Indicator analyzes millions of options trades daily, monitoring every options trade taking place.
HIRO can be especially useful for understanding options flow and market movements.
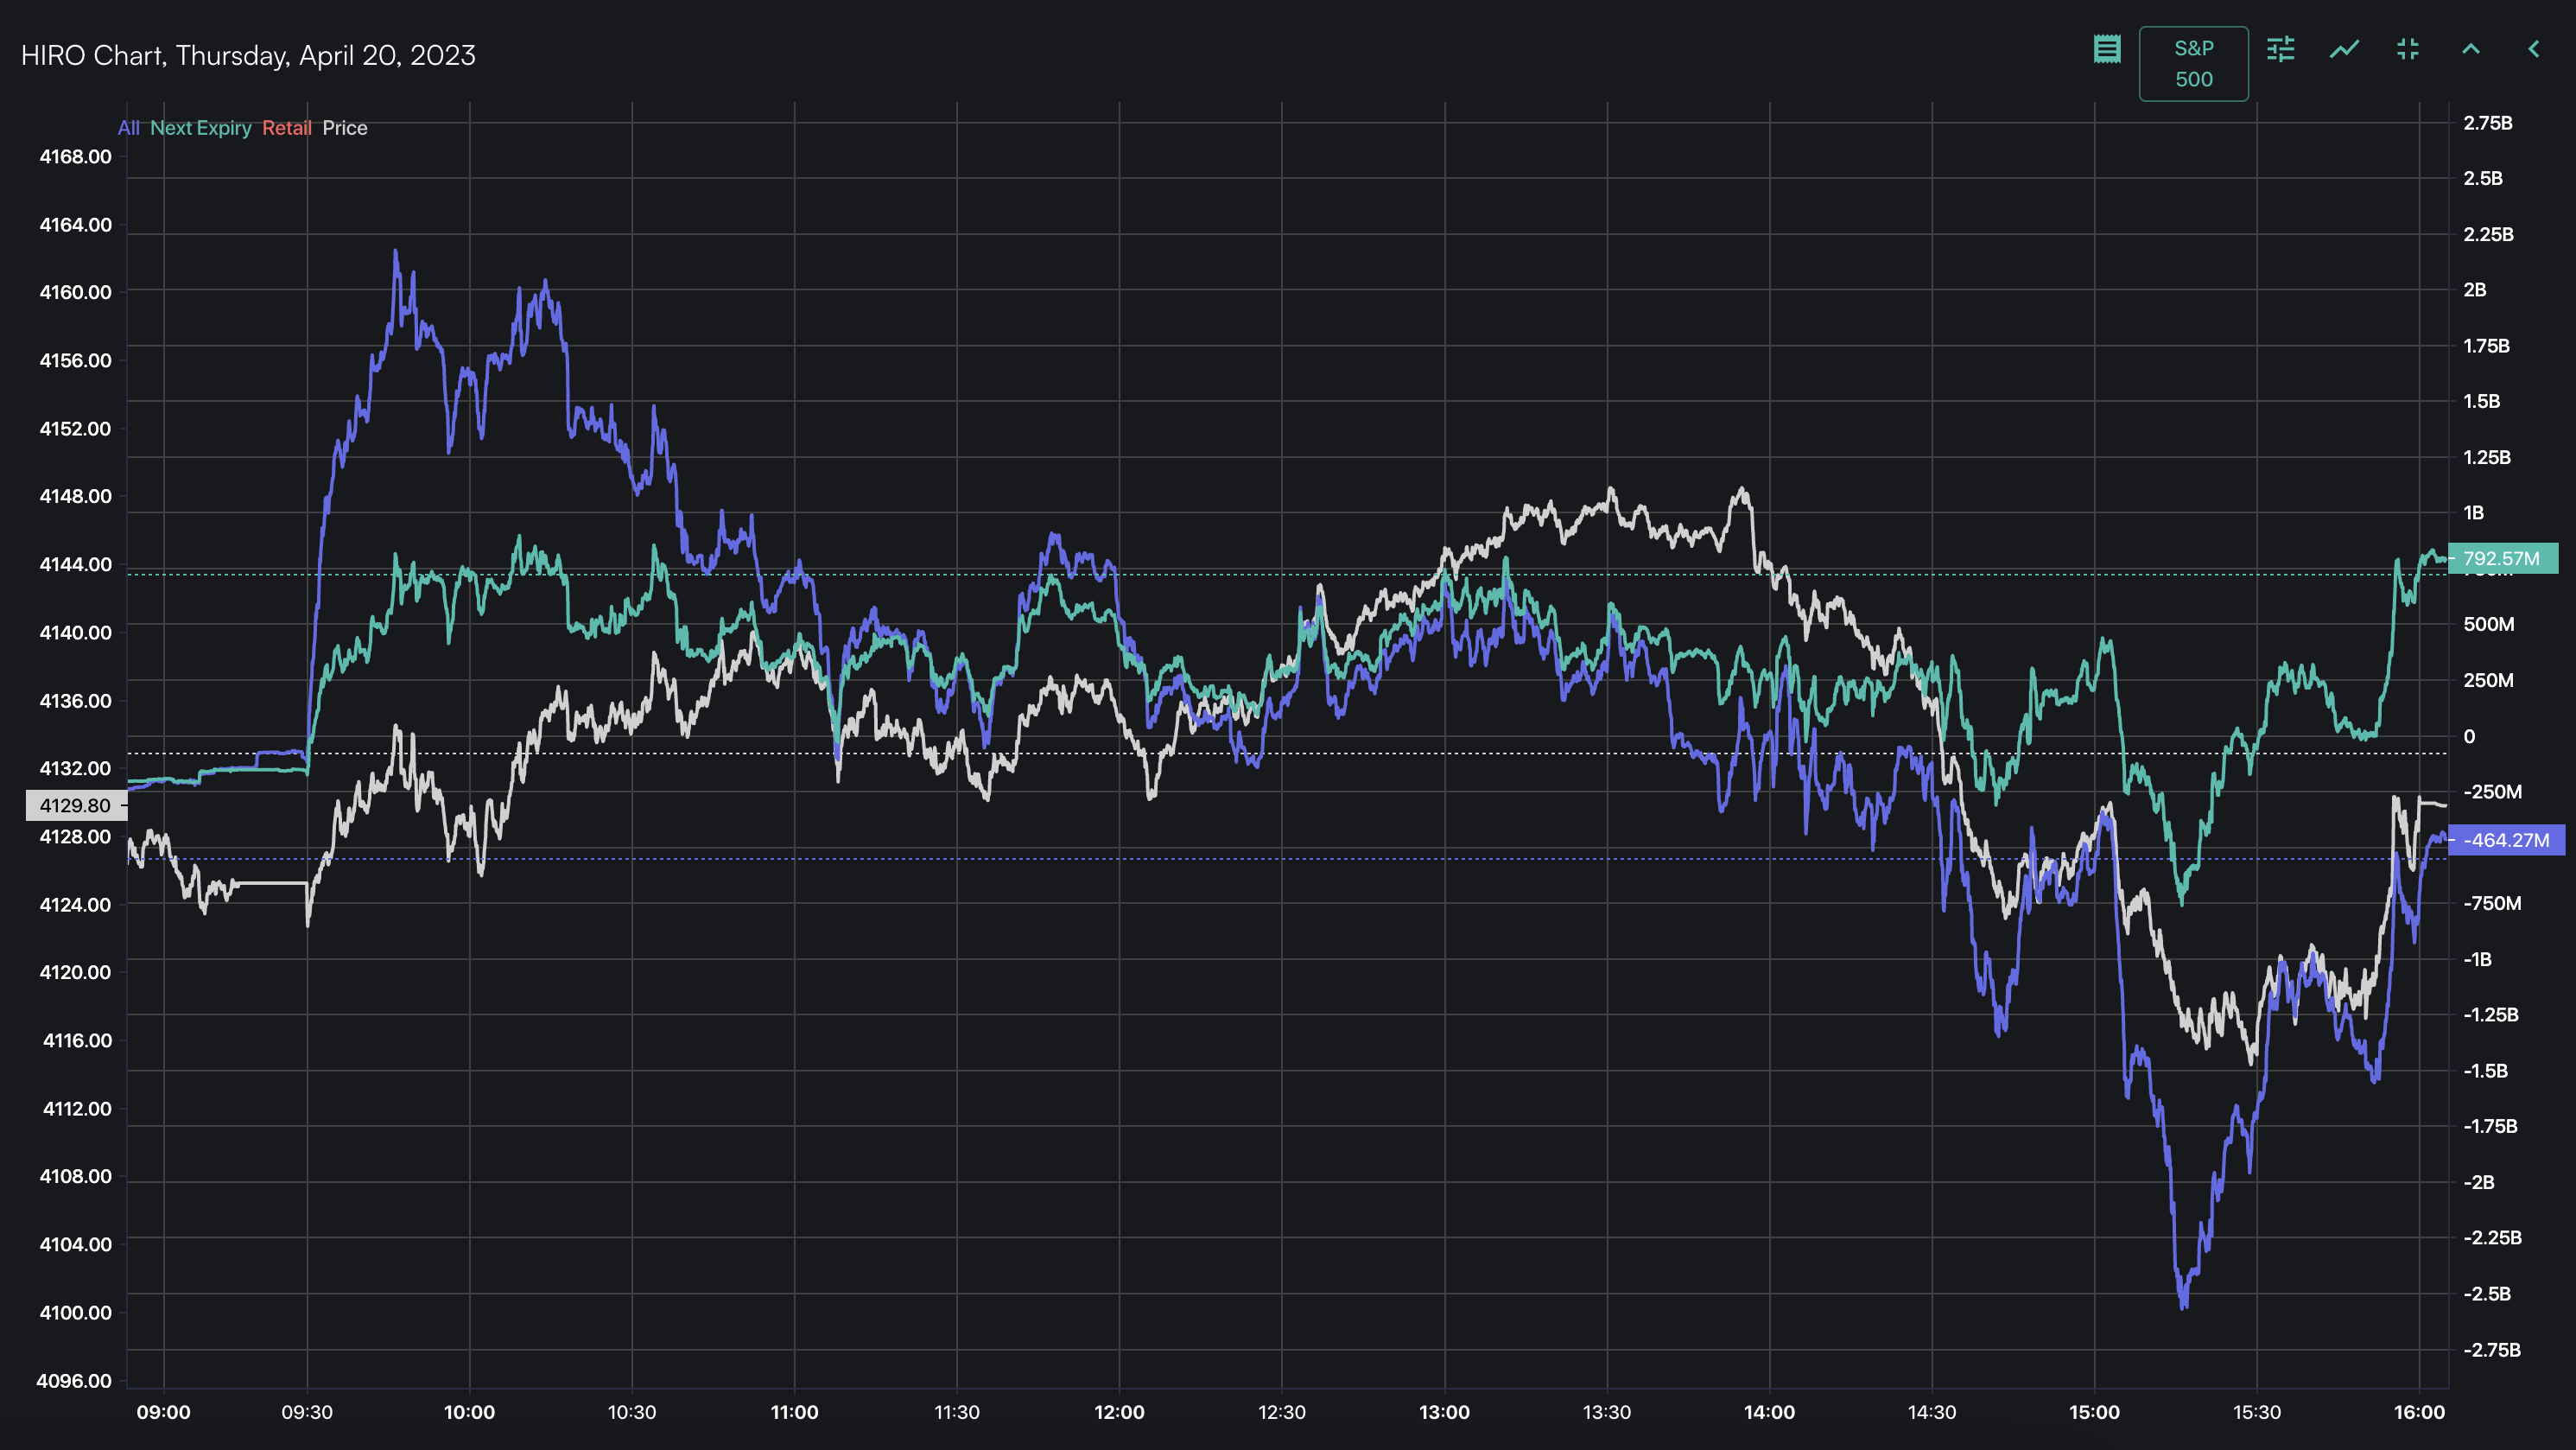
In this video, using an example of the S&P 500 from April 20, 2023, we see that the HIRO Indicator suggested a decline in buying pressures and an increase in put buying, leading to a big rally into the close for the day.
By focusing specifically on the real-time options flow tied to zero DTE trades, we see that the market bounced due to 0DTE flow rather than positions from longer-term investors.
Access today's Founder's Note for FREE!
Expert commentary packed with proprietary key levels, major support and resistance targets, and market analysis.
By subscribing, you agree with our Privacy Policy and provide consent to receive updates from our company.
How to use HIRO to assist zero-DTE trading
In the video walkthrough above, by SpotGamma founder, Brent Kochuba, he demonstrates how to interpret market price action based on hidden option flows from our popular HIRO Indicator. What HIRO shows us is a proprietary measurement of Delta hedging pressure, which reveals directly how bullish or bearish the total option flows are.
HIRO offers traders the ability to monitor flows just from 0DTE options. If options are currently in charge of the underlying price action, which they often are, HIRO will show precisely whether puts or calls are driving the action.
We are also able to view call vs put flows for zero-DTE options only. Additionally, we have a feature which allows you to track how retail customers are trading, based on known signatures of retail trade execution.
HIRO is not volume, but rather a highly unique type of datapoint that we provide for our members. The purple line shows the running count of deltas in the ticker under focus, which in this case is the S&P 500 (SPY + ES + SPX + XSP).
As a note, this is also available for major stocks and ETFs and is not restricted to the S&P 500.

When this purple line is moving up (representing the S&P 500 complex), we know that the total option flow from puts and calls is bullish. Brent takes you through the day and shows how we can use this information both to understand the price action and, in some cases, how we can use it to anticipate future moves.
Toward the end of the video, Brent brings in more detail by showing the zero-DTE only flow, as revealed by the teal line.
We have found that these zero DTE flows consistently reduce volatility during the day and help to prevent large moves from continuing into more severe moves.
When we see 0DTE flows at odds with the underlying price action (shown in white) then this is a strong clue that a trend will revert to its daily mean, such as near VWAP, rather than keep trading in that direction.
Such directional clues create setups for high-probability trades but are not guarantees, which is why it is important to tilt the odds even more in your favor by considering SpotGamma key levels for tactical support/resistance setups, calculated, refreshed, and posted for subscribers every trading day, premarket.
As a direct example from the price action in the video, 4150 is our highest Absolute Gamma level and is precisely where SPX turned around and sold off for the day. It then stabilized near 4100, which is the lower bound of the probable trading range that we have been highlighting recently in our key levels and analysis. This area has also been plainly visible as the dominant range on our chart of Absolute Gamma.
Try SpotGamma HIRO Indicator for Free
Real-time options data
See when options drive stocks
0DTE filter for short-term trades
Try SpotGamma HIRO Indicator for Free
