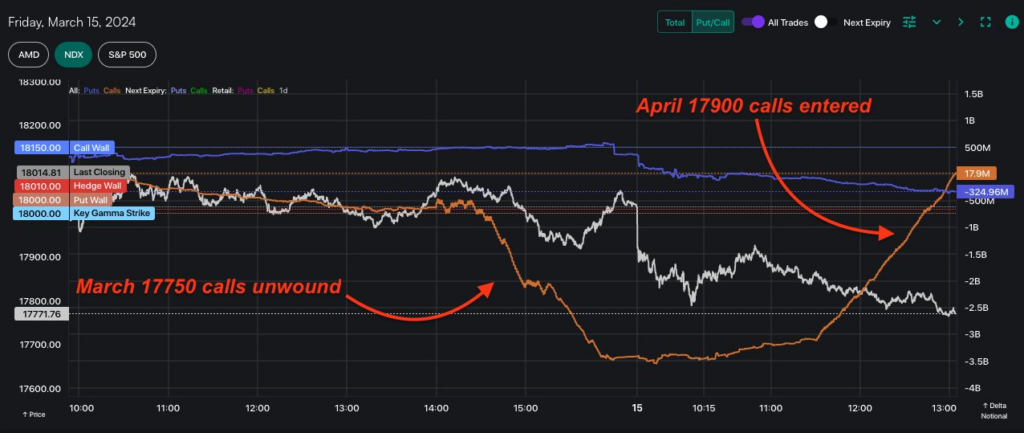
With all the attention on systematic options portfolios, here is a great view into what happens with $QYLD, the Nasdaq BuyWrite ETF ($8bn AUM).
Each month they sell 1 month, ATM NDX calls against a stock portfolio. Call flow is shown via the orange line in our HIRO graphic, which essentially measures the delta of options flow.

Yesterday QYLD closed out of the March 17,750 calls, which were sold last month into Feb OPEX. Today are selling the April 17,900, with target size of ~5k contracts. In this case, the order is VWAP’d by a broker, and then a single print is given to QYLD at the end of the day.
The VWAP algo is what gives the linear, angled look to the HIRO call line. This facilitation is why our HIRO shows the calls being sold yesterday (when QYLD is covering their March short) and bought today (when QYLD is selling their April calls).
