One of the obvious beneficiaries of the Trump victory is Elon Musk, and TSLA. The day after Trump’s election, TSLA stock rose +12%.
Traders are now pricing in even higher levels for TSLA, which has created a positive call skew. Call skews occur when traders start to price in a higher chance of upside (i.e. calls) vs downside (puts).
Shown below is 1-month Exp skew (teal) and Jan Exp (gray) vs their 90-day statistical ranges (shaded cones). You can see that each skew is in the center of its respective cone, which suggests IV is only “average” compared to recent history.
Further, with at-the-money IV marked at 53%, traders are pricing in ~3% daily moves for TSLA. 3% is not small, but based on recent history we’d argue IV its not yet “rich”.
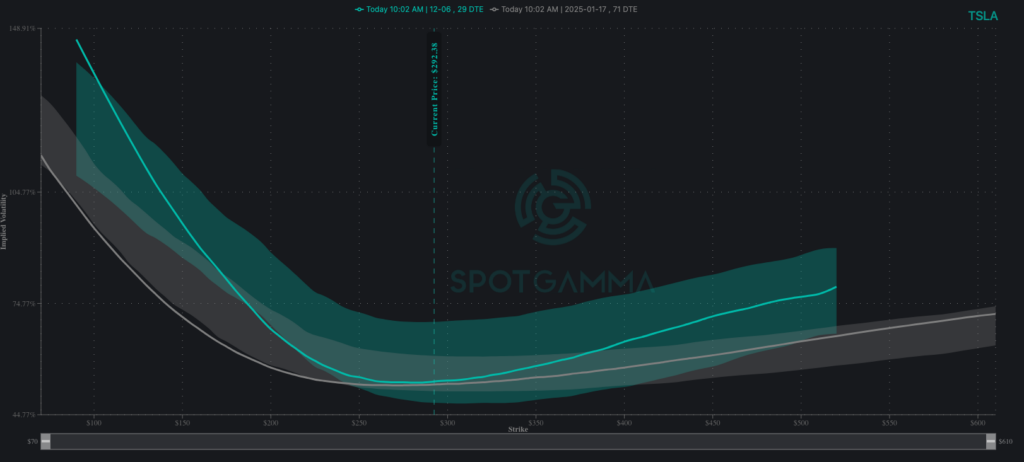
TSLA 12/6 Expiration Skew (Teal), Jan Exp Skew (Gray) Source: SpotGamma
Let’s take a quick look back.
Heading into the election, when TSLA stock was near $250 traders had bullish upside bets on TSLA stock. To this point, on 11/6 our TSLA gamma curve (GEX, yellow line, below), had a minima near ~285. This signifies that options dealers had on a negative gamma position into the 285 level.
To hedge a negative gamma position, as TSLA moved higher options dealers likely needed to buy shares of stock into 285.
Accordingly, following the Trump election, the stock rose to 285 – which coincidentally matches that low point on the 11/6 GEX curve.

TSLA Gamma by Strike (GEX) Source: SpotGamma
Our options positioning update for 11/7 (black) shows that traders increased their bullish bets by buying calls near the 300 strike. This changed our GEX curve to have a minima near $300. This implies that options dealers will now have to continue buying shares of TSLA stock into higher prices, which occured on 11/7 as the stock hit 297.
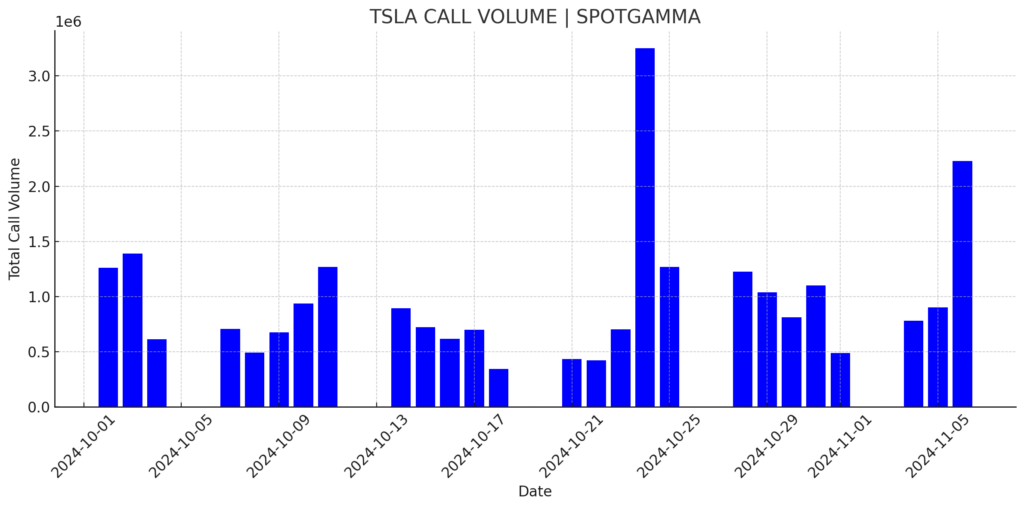
With the stock +12% on 11/6, TSLA traded 2.2 million call options vs an average of 972k. Interestingly, TSLA traded >3.3 million calls on 10/24, after positive TSLA earnings.
Further, our HIRO indicator, which measures options deltas traded, showed a net $1.3 billion of positive delta in TSLA options. The 30-day high for TSLA was $3.6 bn (on 10/24) – implying 11/6 was “active” but no where near “extreme”.

TSLA’s HIRO Chart from 11/6/2024 Source: SpotGamma
TSLA: The Original Gamma Squeeze
Many may forget that TSLA was the “OG” of gamma squeezes. Before GameStop & Meme mania in Jan of ’21, massive call volume was piling into TSLA, culminating in TSLA’s addition to the S&P500 (12/20).
You get a sense of how big this call volume was in the chart below (blue line), versus current volumes – and make a mental note of just how big TSLA volume was into Dec ’20, often breaching +11mm contracts/day.
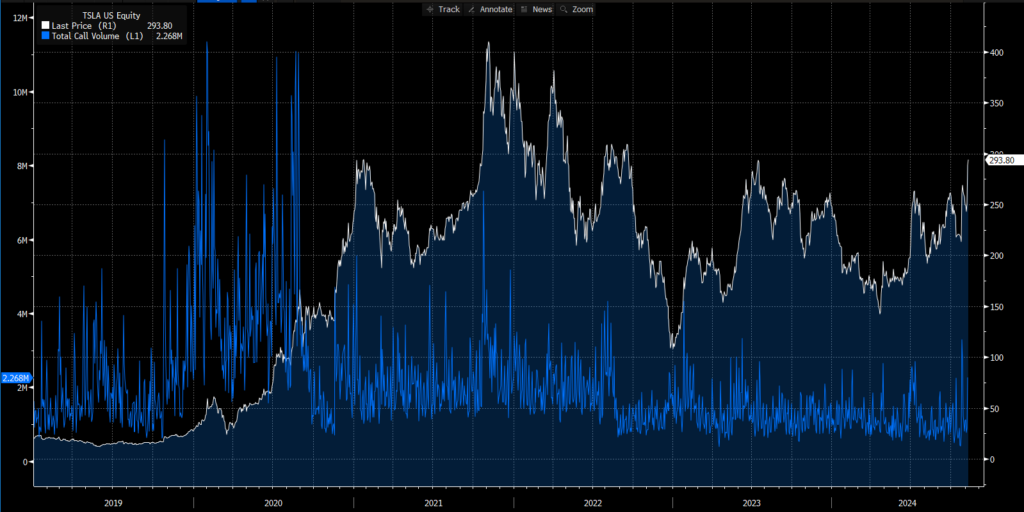
TSLA stock price & call volume. Source: Bloomberg
That is not to say that TSLA call volumes are currently small. In fact, over the last month TSLA has the 3rd highest total call volume of any US listed asset, trailing only NVDA & SPY.

NVDA is currently the champion of gamma squeezes. Its call volume in early 2024 often breached +15mm contracts, as the stock rallied 200% in ’24.
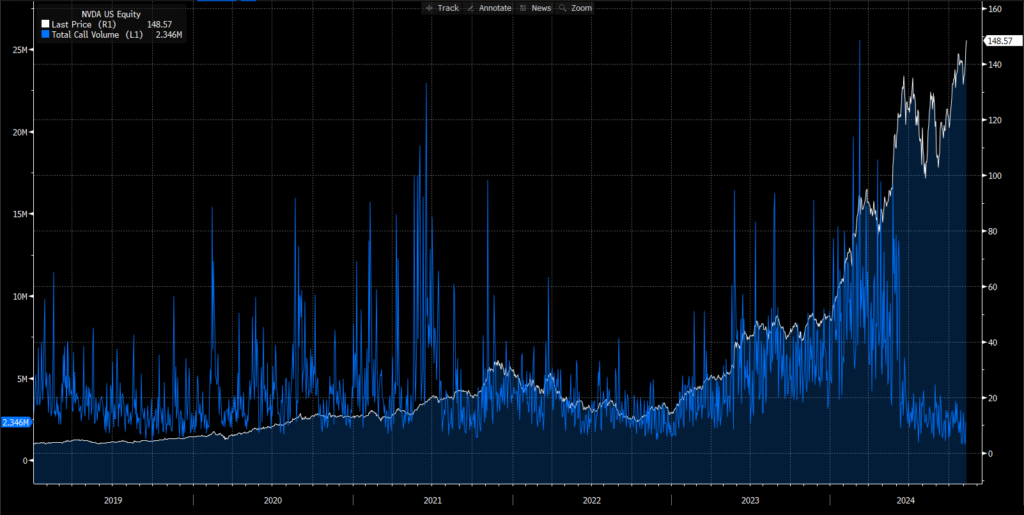
NVDA stock price & call volume. Source: Bloomberg
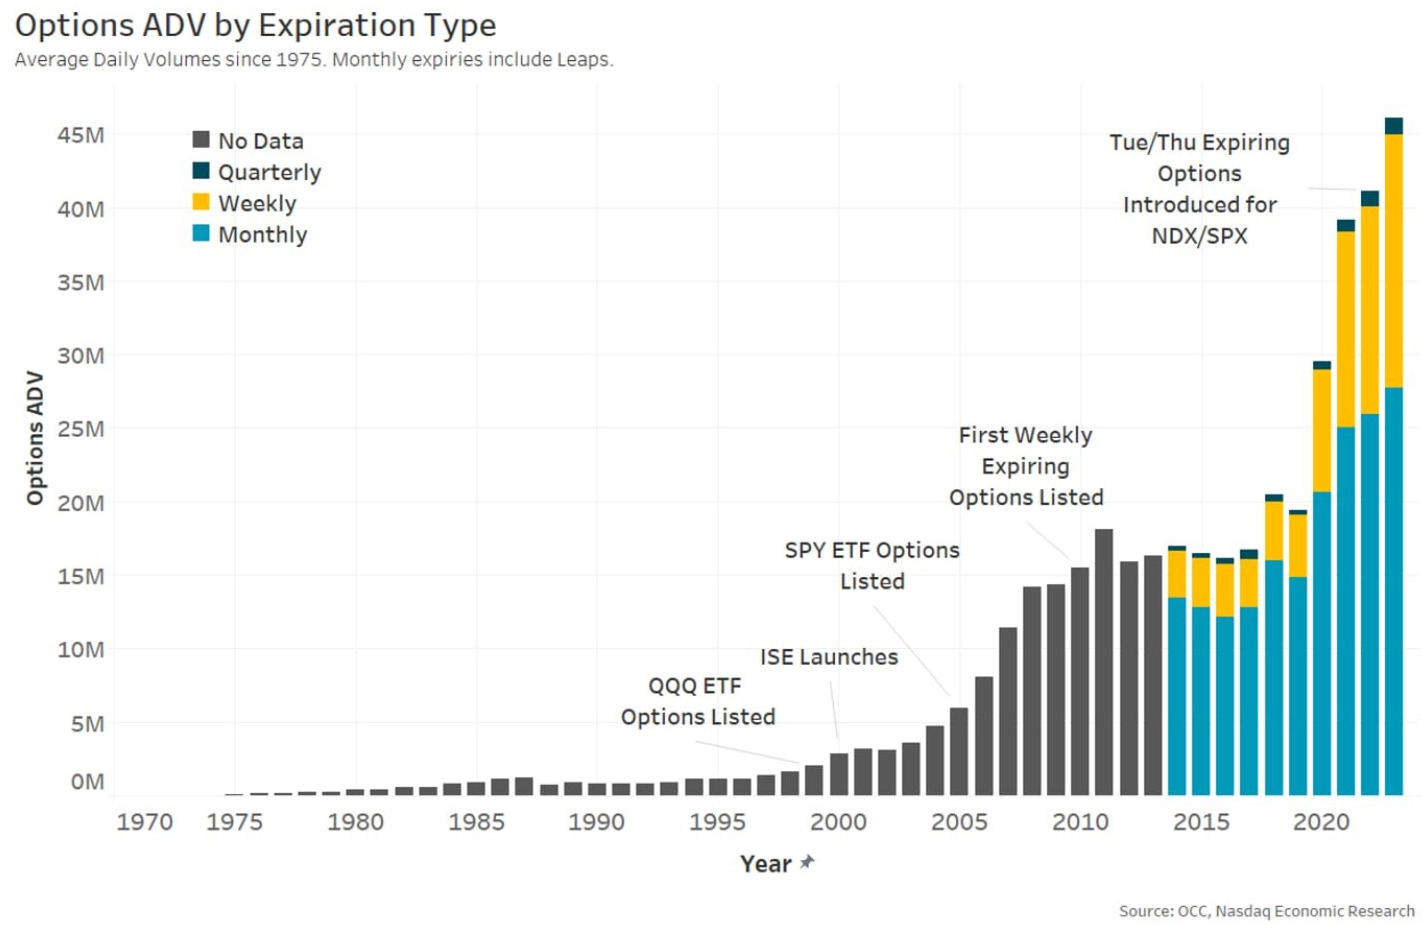
This highlights an interesting point – that the options market is much larger than it was back in 2020. You can see this in the chart of options ADV, below. Traders now have more access to and understanding of options trading vs 2020. We think NVDA’s share price has benefited from this larger options market, as call buying brings bullish hedging flows.
Enter: TSLA Ludicrous Mode
TSLA is currently ~35% from all time highs at 400, set in late ’21.
It doesn’t take a macro analyst to see that the current political regime will be much more friendly to TSLA and its endeavors, after experiencing a fairly combative relationship with Biden.
Does that mean it will fundamentally improve?
We don’t know, but optically the situation has improved.
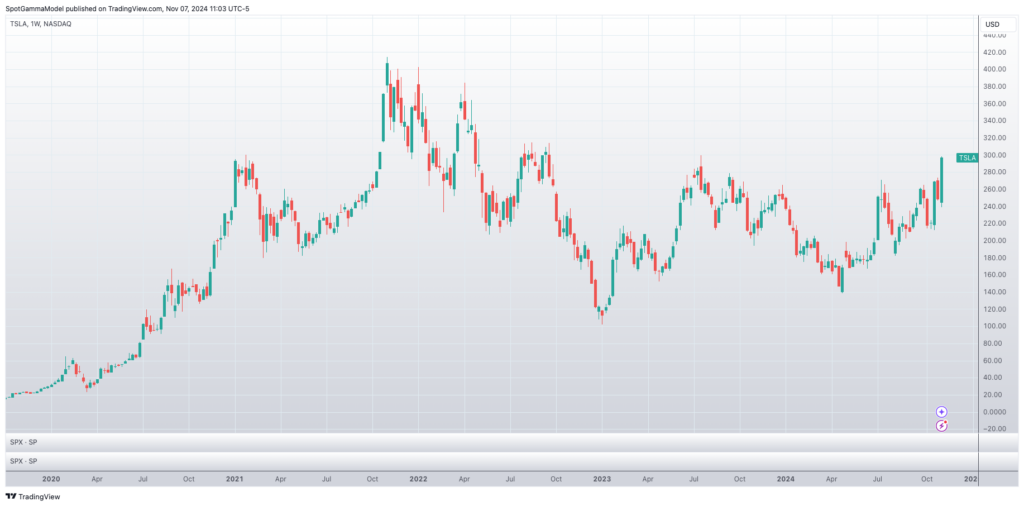
Those optics, we believe, may start to unleash TSLA call buyers into year end. This view is fostered by a generally bullish equity environment, as indicated by the S&P500 up 37% year-to-date.
Further, traders seem to be under-positioned for a TSLA rally >300.
Shown below is gamma-by-strike, as of 11/7. As you can see, there is massive call volume (orange) at 300, but call positions dwindle above that level.

TSLA Gamma by Strike. Source: SpotGamma
Our belief is that traders are going to have to re-position for higher TSLA prices, which adds to call positions above 300, which in turn may create a gamma squeeze. Accordingly, we would not be surprised to see TSLA set new call volume records, and overtake NVDA at the top of call volumes.
Should this happen, there are two upside levels to watch.
First, is the all-time-high area of $400, and second is the level of IV.
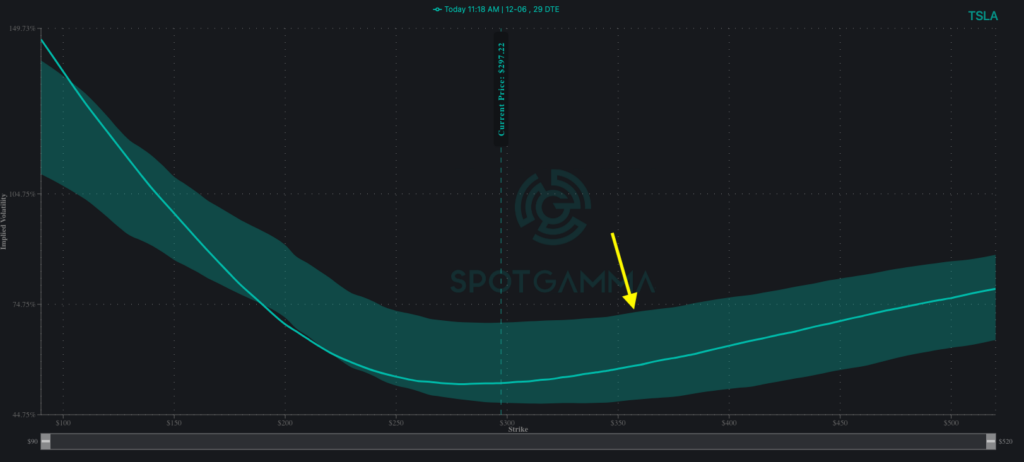
Should call skews raise significantly (ex: to the top of the 90-day range) it could be a sign of the rally topping.
Often times in major stock moves higher, call values elevate to levels that are prohibitively expensive. When this happens, call buyers may turn into call sellers, which reverses dealer hedging flows from buying, to selling.
TSLA 1-month skew. Source: SpotGamma