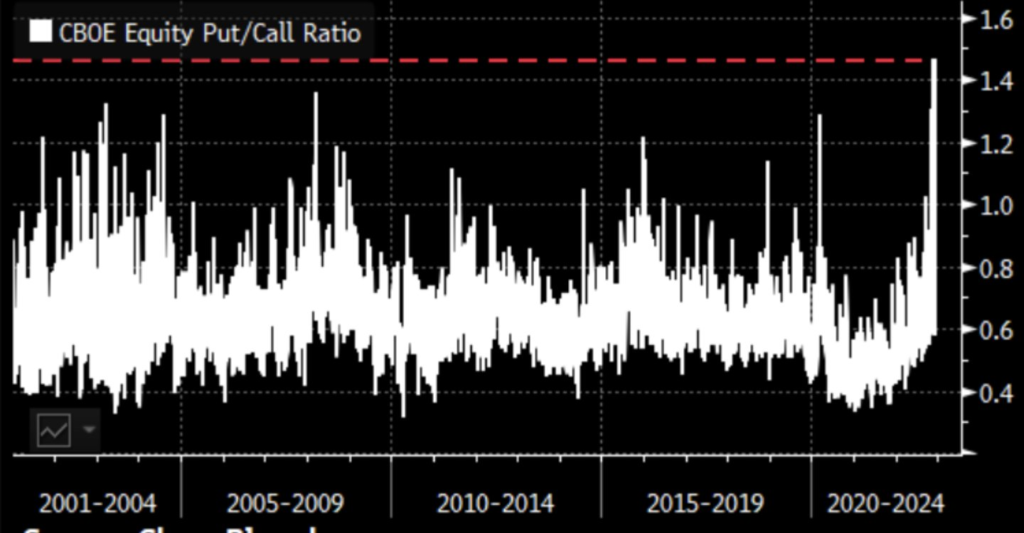
A great deal has been made recently about the record CBOE Equity Put Call ratio, with many speculating this metric had dire implications. These alarmists assume that this metric is suggesting large amount of puts are being purchased in order to hedge downside movement in single stocks.
SpotGamma’s has made an extensive effort to dispel these notions, as our analysis indicates that the record put/call readings are the result of position shuffling amongst large trading firms in stocks like TSLA, AMZN, DIS and NVDA. Essentially, the record CBOE Put/Call Ratio has a high level of noise due to these positional, “arbitrage” trades.
Why is the CBOE Put/Call Ratio So High
It is due to a combination of the following:
- Many stocks declining significantly over the past year
- Interest rates increasing sharply over the last several months
The sharp decline of many single stocks over the past year has driven many put positions deep in the money. As a result of being deep in-the-money, many of these positions have very large notional values. Over this same time, interest rates have increased sharply, which impacts the value of cash positions in a way that wasn’t material when interest rates were near 0%.
A trader holding a deep in-the-money put, is doing so in lieu of its cash equivalent, and any associated interest. As a result, there are many deep in-the-money[ITM] put buyers whom may be disadvantaging themselves by not selling the deep ITM put option, and collecting interest on the proceeds.
Sophisticated counterparties are aware of this situation, and are thusly entering into trades which may allow them to become the short counterparty to these long deep ITM puts. By doing so, they collect the associated premium from being short deep ITM puts, and can collect interest on those funds.
In short, there is a game amongst firms to become the counterparty to the long term, deep ITM puts.
Example: Long put owner, holding 500 Jan 230 strike TSLA PUTs, with 1 month to expiration:
- Notional Value: ~$7mm
- 1 Month Carry Cost (time to expiration): ~$20k
What are the Features of this Put Order Flow
To become the short interest against these long puts, firms trade large numbers of deep in the money puts at strikes which have large open interest. To isolate directional risk, they also add another large put, and/or short stock, effectively creating a directionally riskless* spread. On the same day of trade, they then exercise all legs of these option positions.
Upon exercising the options, the Options Clearing Corp [OCC] will assign option exercises via a random lottery process. Firms seeking to become the short put interest hope that the existing short put holder is exercised, and replaced by their new short put trade.
These trades have very common, repeatable characteristics that make it easy to identify:
- The puts traded are deep in-the-money, often tied to January OPEX or longer date expirations
- These are often spread trades, often done on the floor of an exchange like the CBOE
- The volume only seems to occur on strikes with existing open interest
- Despite large volume, open interest most often remains unchanged the next day.
- The put activity is most significant in stocks which have declined sharply, as the weak stock prices have driven more puts deep ITM: TSLA, AMZN, DIS
- Volume tends to be highest on Wednesday, due to advantageous timing of settlement
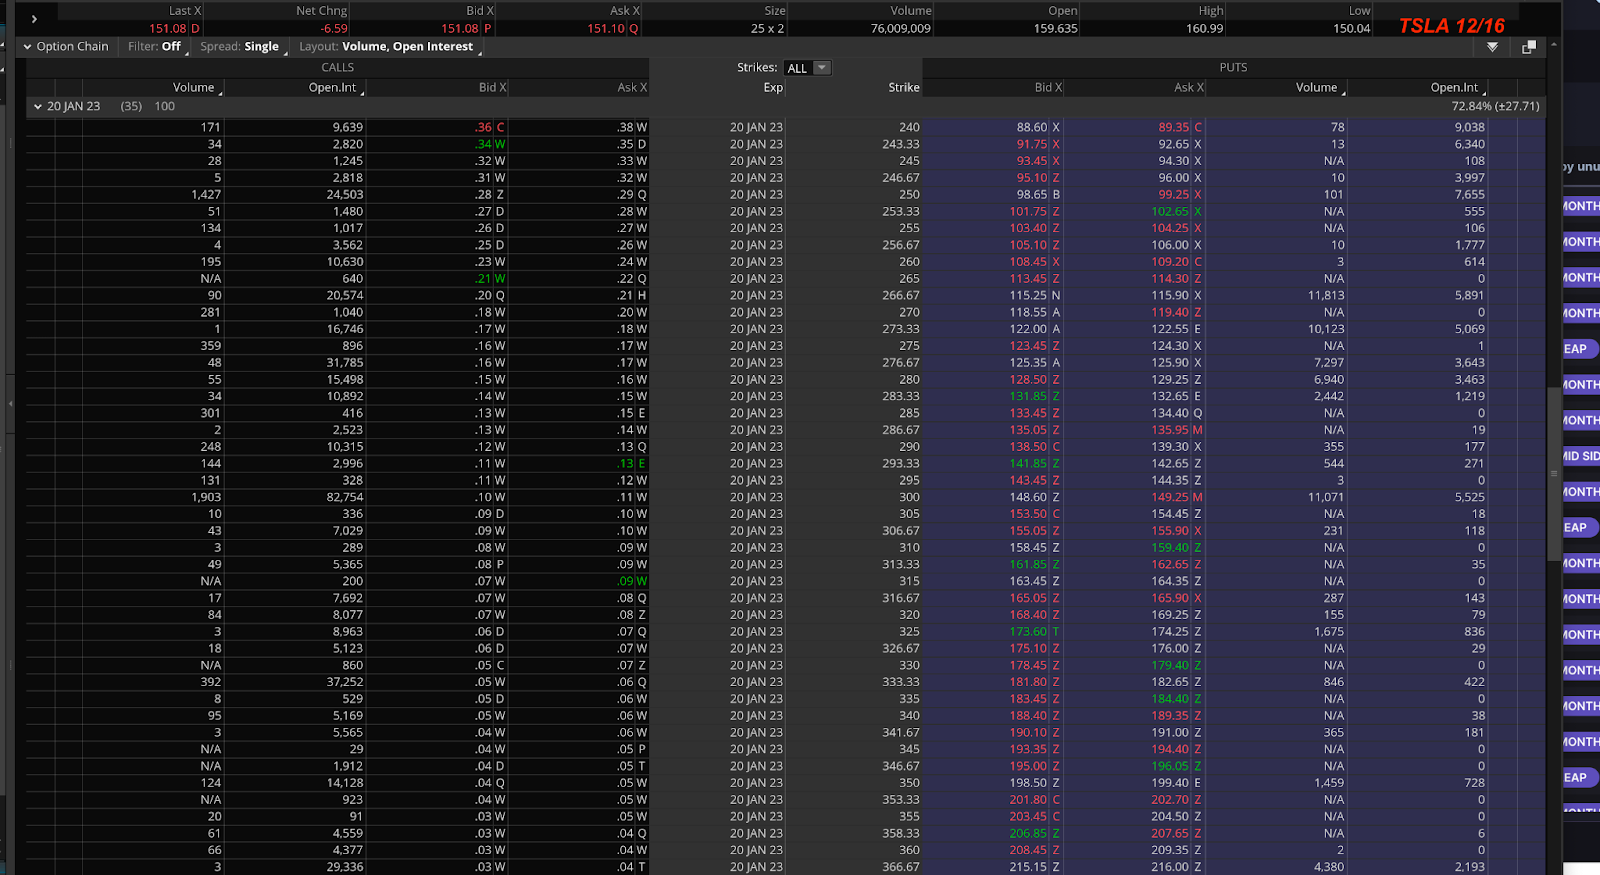
Below is an end of day snapshot of TSLA options with a January expiration. On the right are deep in the money put options. Note how the volume only occurs for strikes which have existing open interest, and that volume greatly exceeds existing open interest.
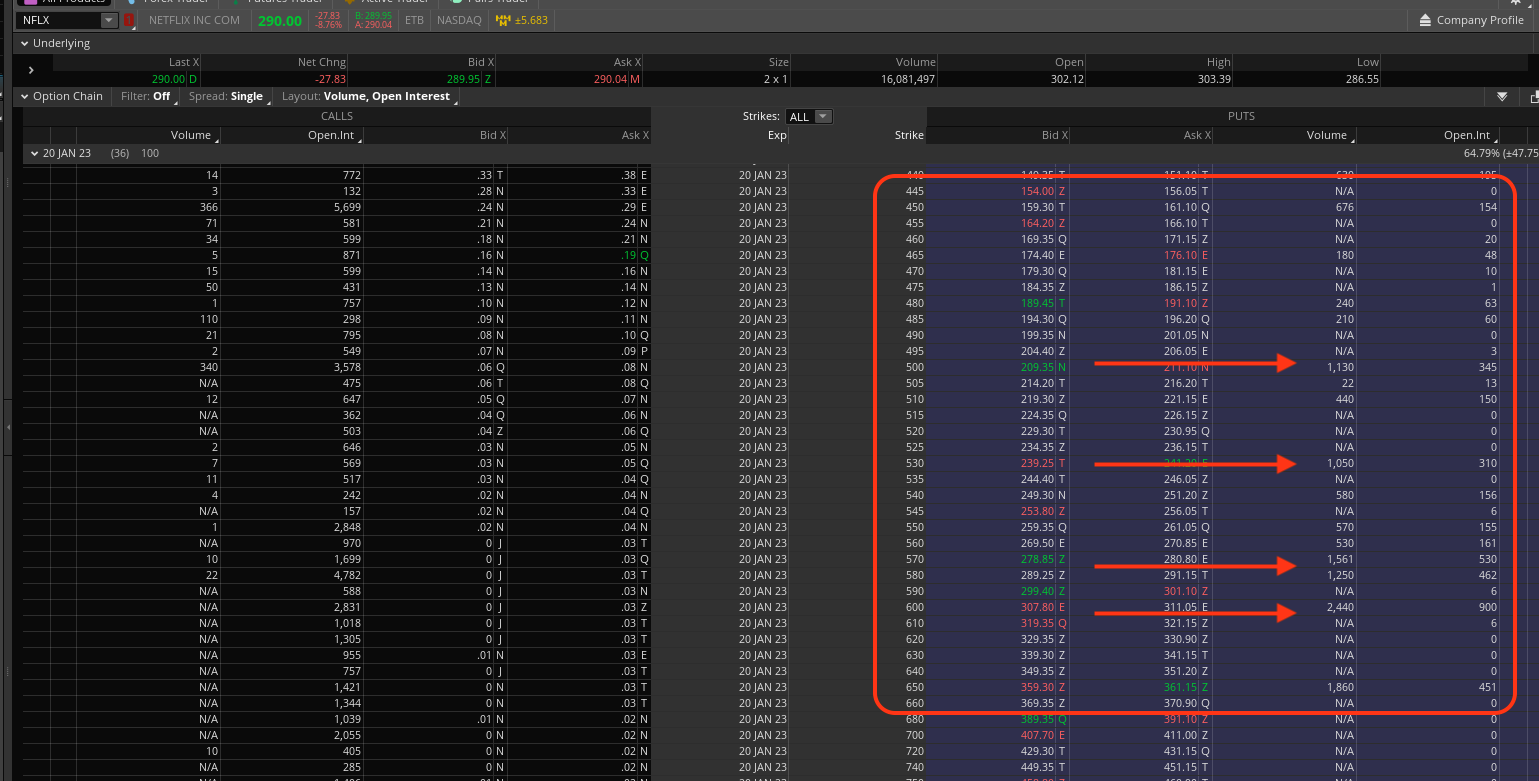
The key here is that these put trades are taking place at deep in-the-money strikes, and only with strikes that have existing open interest. Further, our analysis shows that these trades do not translate into open interest changes the following day. In other words (and as stated above), these puts are traded and exercised on the same day as to not increase nor decrease the start of day open interest.
This further implies that there is no intention on establishing a position for directional purposes, as you would see an increase in open interest if a trader was seeking a long term hedge.
Identifying Put Spreads
Each week, the Options Clearing Corp [OCC] produces summary data detailing options buying and selling across various asset categories (equities/etfs/inidices). In the data, shown below, you can see that there is a tremendous surge in premiums for put buying (top left), but also a corresponding move higher in put selling (top right). Its important to note here that this surge in put premiums beings just after July 2022.
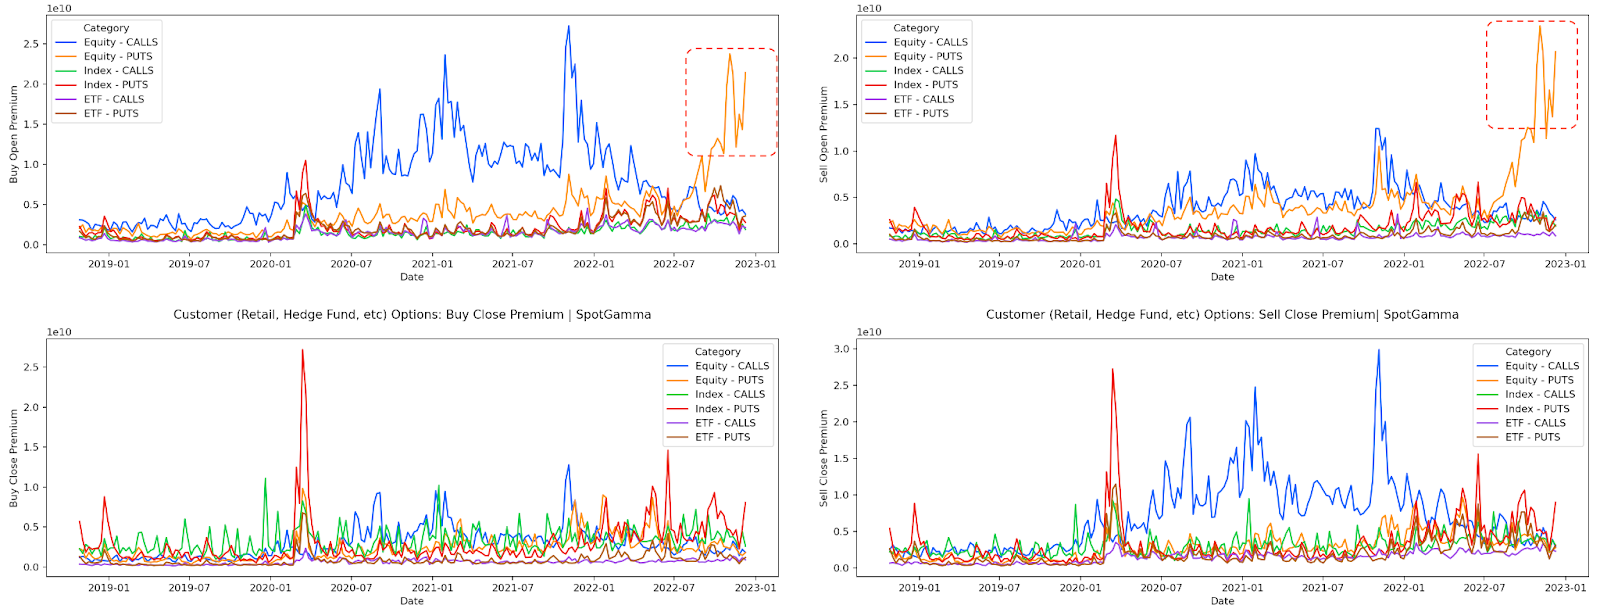
This data signifies that the put buying is being offset with an equivalent value in puts. This is something you would see when traders are entering into spread or arbitrage plays. If traders were making a significant directional bet, you would likely see a sharp difference in either puts being bought or sold.
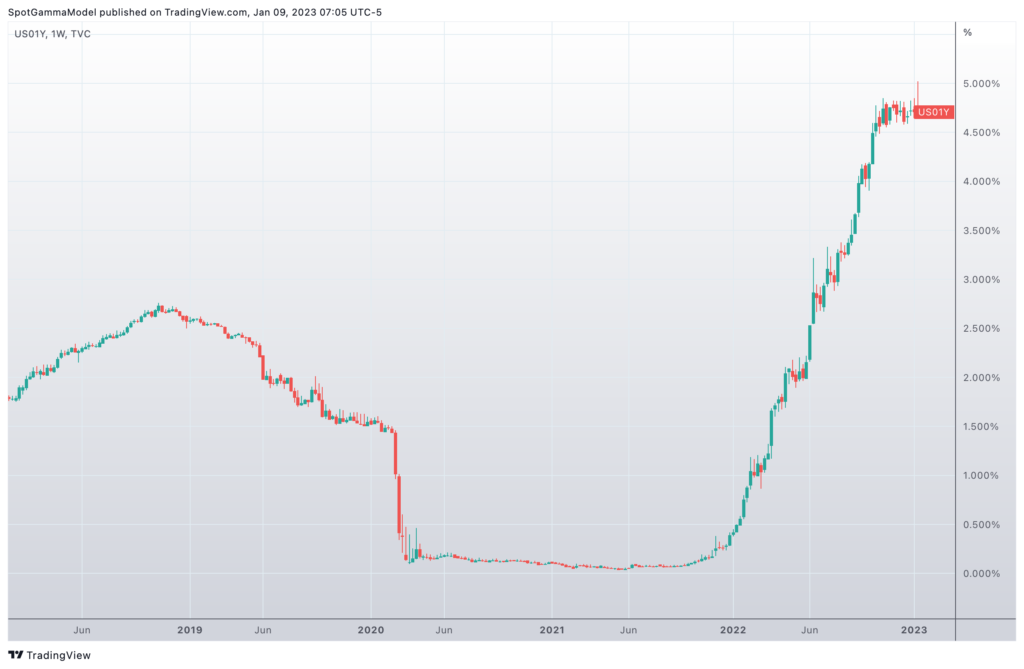
Interest Rates Moved Markedly Higher at the Same Time
This year has seen the fastest pace of interest rate increases in several decades. Note below the dramatic shift higher in rates beginning around July 2022, which corresponds with the shift higher in put premiums being traded (above). This suggests that interest rates hit a level which unlocked this rate based trading strategy. We surmise that prior to July of 2022, interest rates were not high enough to compensate traders for transaction costs and fees related to this trade.
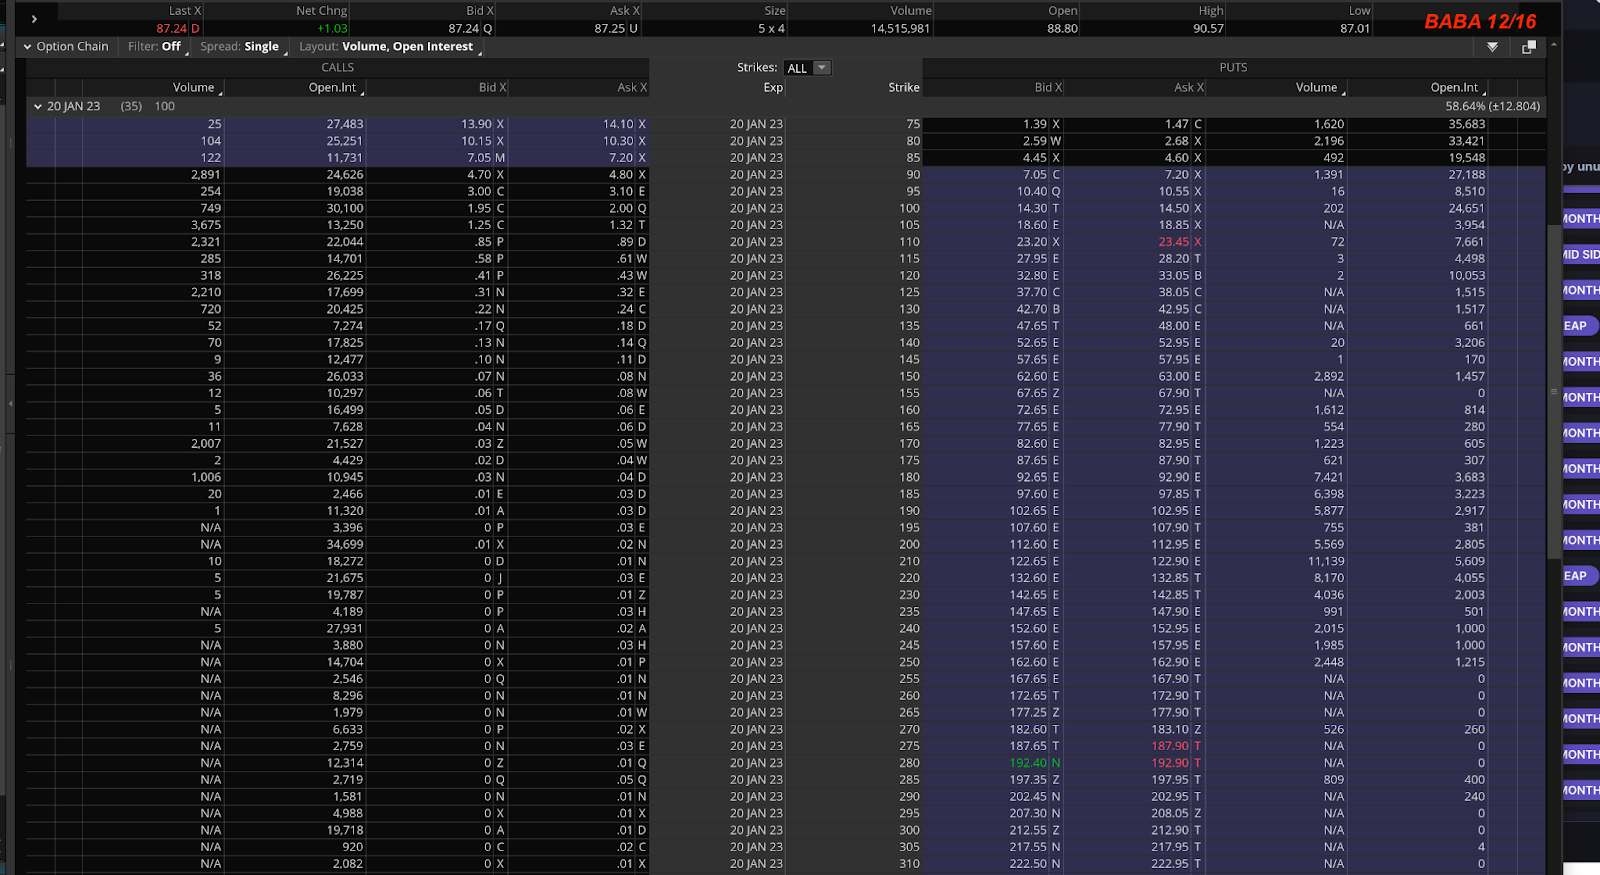
More Example Snapshots
Below are several screen captures which provide snapshots of this large put order flow. These snapshots are from various dates, and various underlying securities.
Further Reading On this Orderflow
- There is an oft-cited WhitePaper from 2006 here, which outlines a theory related to this orderflow:
- CBOE writeup on this activity
* Risk association with this trade lies in if the underlying stocks rise substantially (often >100%) or the long put holder choses to exercise their position.
