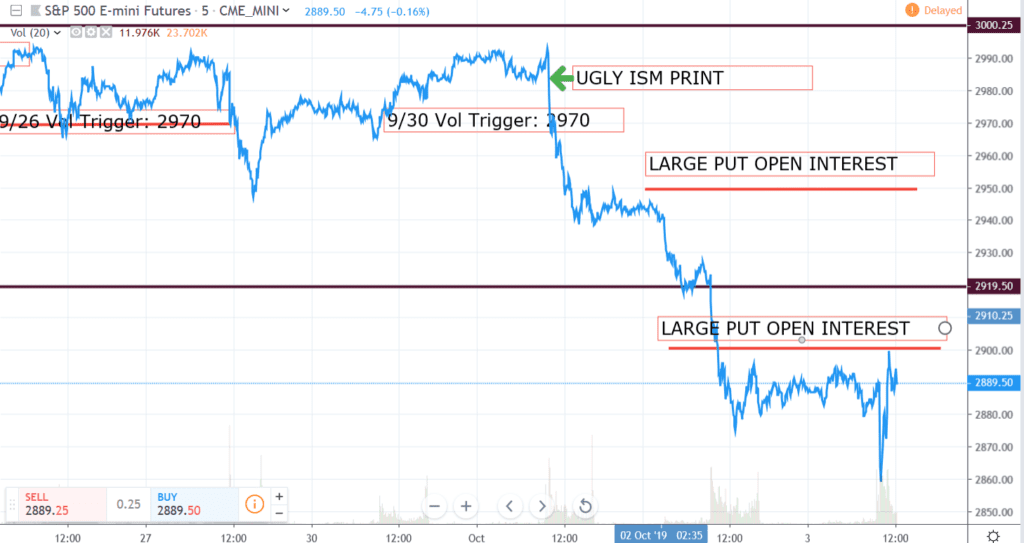
Here is a brief summary of the October Negative Gamma move so far. On 9/30 around the 3000 level in SPX we calculated a long gamma position for the market, but that quickly changed due to a very ugly ISM print. Once the market punched through the 2970 volatility trigger level, dealers fueled the selloff down to around 2900, where we currently stand (10/3). As per JPM:
[JPM analyst] Kolanovic basically says the equity market move post the ISM was mainly due to:
1, dealer short gamma needed to sell quickly as index started moving sharply lower, ” Technical flows likely drove more than ~$100bn of equities selling in a 48-hour period.”
2, CTA went from long, to selling out longs to selling the market short. Notes that the inverse could easily happen should we climb a little higher (per Friday 50 bps), ie short gamma works both ways and CTAs could start buying.

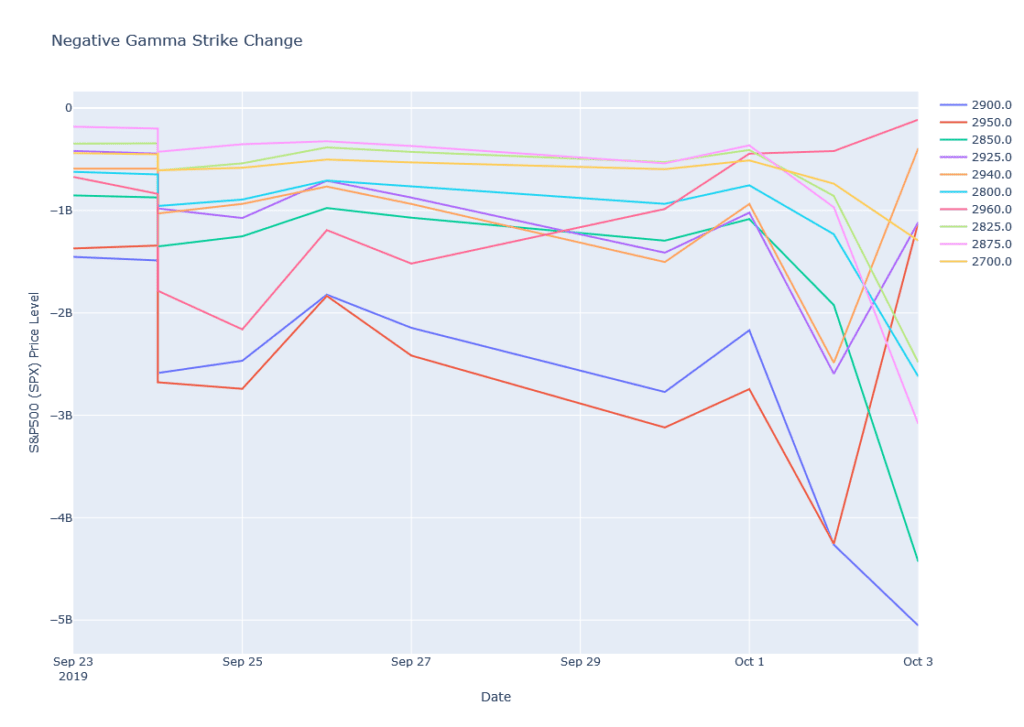
There is large negative gamma in the market through the 2900 puts. These positions are interesting to watch as these positions are vega sensitive. If the market stalls out here or rises slightly we could see those put positions lose value quickly, causing dealers to buy back stock. Notice the amount of negative gamma in the chart below:

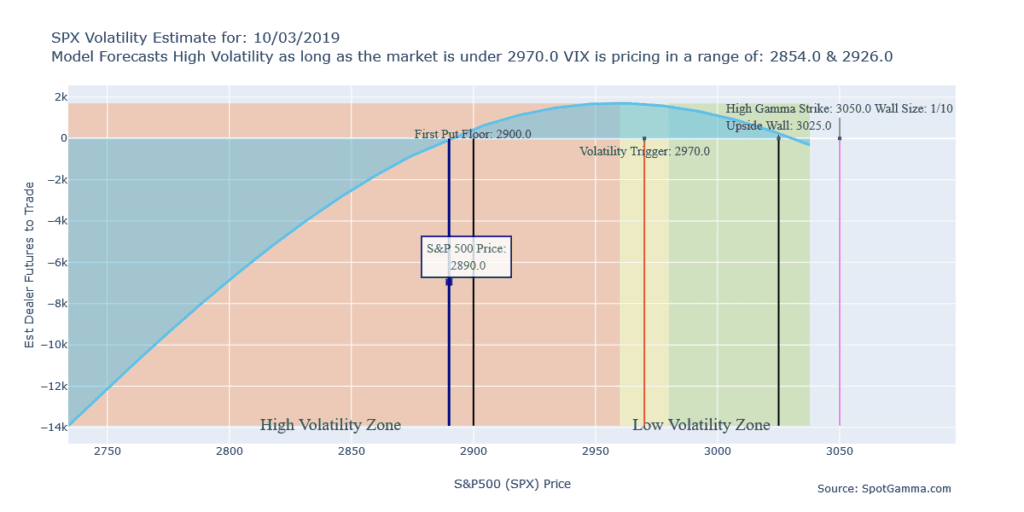
Here is the most recent gamma run, showing that 2900 put floor and a volatility trigger (aka 0 gamma) that still rests at 2970.

