Gamma exposure (GEX) estimates the value of underlying stock that must be bought or sold by options market dealers as the price of the underlying asset moves. GEX can be used to measure where large options positions create support, resistance, and volatility in the underlying asset. In plain terms, gamma exposure helps you understand if the underlying instrument is likely to stay range-bound, or whether it is primed for larger price swings.
GEX is calculated by estimating the positions of options dealers (market makers), who take the opposite side of most options trades. These dealers hedge their risk by buying and selling the underlying asset or futures contracts. These hedging mechanics can dampen price action to create areas of mean-reversion, or they can amplify price action to expand the asset’s trading range.
| Environment | Positioning | Dealer Behavior | Impact |
|---|---|---|---|
| Positive gamma | Traders are net short options, and dealers are net long options. | Dealers hedge against price action by selling rallies and buying dips. | Volatility compresses, trading ranges tighten, and moves mean-revert. |
| Negative gamma | Traders are net long options, and dealers are net short options. | Dealers hedge with price action by buying rallies and selling dips. | Volatility expands, ranges widen, and breakout moves trend or accelerate. |
Gamma exposure helps you to anticipate the price action of the underlying asset by showing you how dealers are likely to hedge. Note that GEX informs traders of market structure and volatility sensitivity, not the market’s expected direction. Knowing whether dealers hold largely positive gamma or negative gamma for a given asset helps traders anticipate the magnitude of price movement.
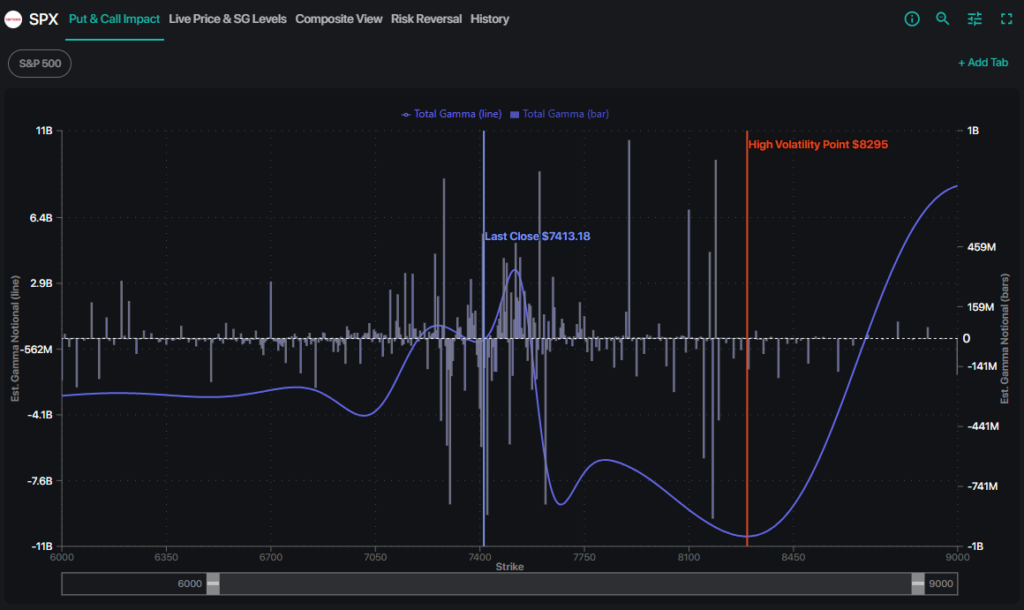
SPX gamma exposure by strike in SpotGamma’s Equity Hub. The longest bars mark where dealer hedging is most concentrated, which creates levels that traders can watch as potential support, resistance, or acceleration points.
What Gamma Exposure Actually Measures
Gamma exposure (GEX) estimates the aggregate gamma of dealers’ option positions across a chosen set of strikes and expirations. Gamma itself measures how much an option’s delta changes for every $1 move in the underlying. Delta itself measures the relationship between an options price and the underlying price, and is used by options dealers (market makers) to calculate their hedging requirements.
Calculating GEX across all option positions shows how quickly dealers’ hedging activity will need to shift as price moves. This informs traders how reactive dealers may be to movement in the underlying price.
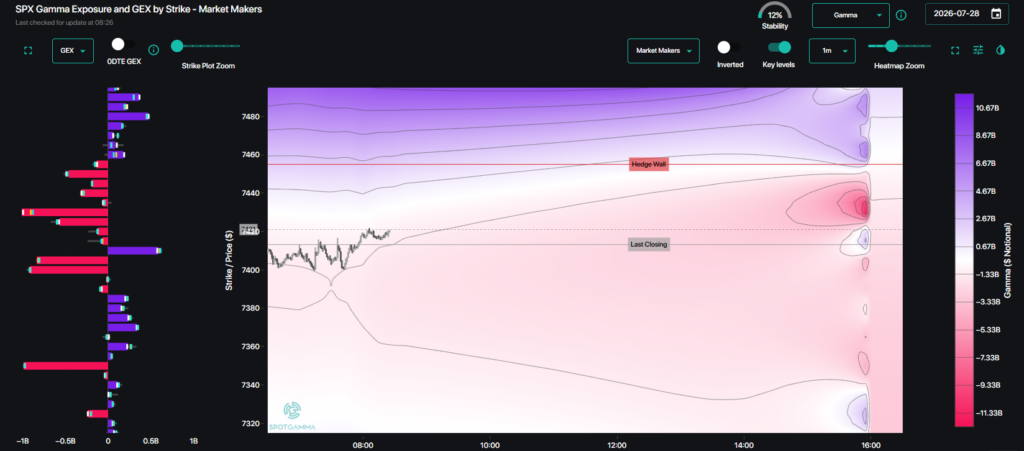
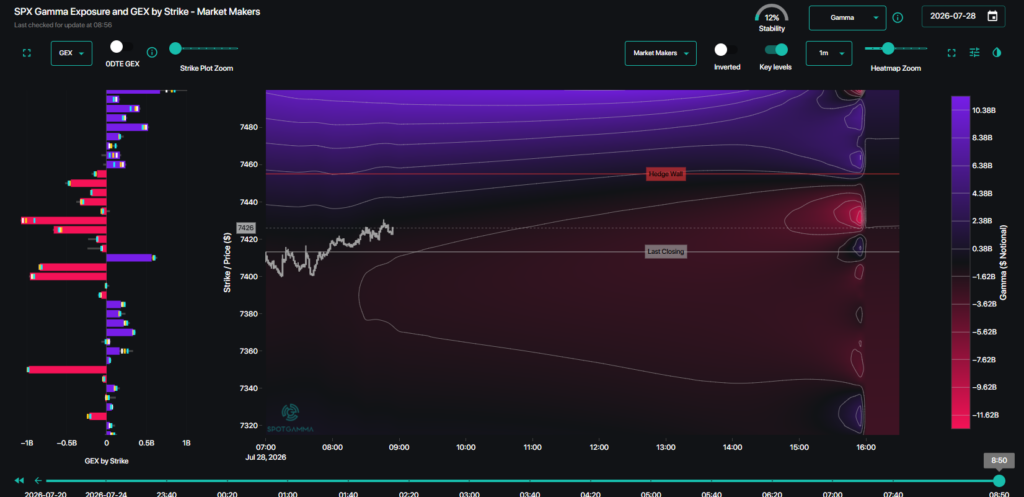
SpotGamma’s TRACE heatmap shows Market Maker gamma exposure across strikes and expirations. Red zones indicate positive gamma, while blue zones indicate negative gamma.
GEX Research
Academic and exchange-hosted research (including peer-reviewed studies on Gamma Fragility) support the importance of understanding options market gamma. The relationship between dealer gamma exposure, hedge rebalancing, and realized volatility is both quantifiable and impactful.
Positive Gamma vs. Negative Gamma: Opposite Market Dynamics
GEX models will provide two different overall states, those being positive gamma and negative gamma. Keep in mind that the magnitude of gamma exposure matters, as well as the overall direction.
Positive Gamma: Stabilizing price
When the GEX value is positive, this generally means that dealer rebalancing will involve buying into dips, and selling into rallies. All else equal, that counter-trend flow can dampen moves and contribute to lower realized volatility or mean reverting price action.
- Intraday price ranges may compress.
- Moves into gamma-heavy strikes may slow, pin, or reverse.
Negative Gamma: Amplifying
When the GEX value is negative, this tends to mean dealer rebalancing will involve buying into rallies, and selling into dips. This pro-trend flow can accelerate an existing move and contribute to wider realized price ranges.
- Intraday price ranges may expand.
- Breakouts or breakdowns may become harder to fade.
How Gamma Exposure Is Calculated
A transparent GEX calculation has a few core components: a spot price, option gamma (or the inputs to estimate it), contract counts, a contract multiplier, the included strikes and expirations, and (most importantly) an assumption or model to determine dealer inventory.
| Input | What it controls | Important limitation |
|---|---|---|
| Unit gamma (Γ) | Delta change for a $1 underlying move | Changes with spot, volatility, and time |
| Estimated dealer position | Long-gamma (+) or short-gamma (−) sign | Public OI does not isolate dealer positioning |
| Contract multiplier | Converts the value of one option contract to underlying units | Usually 100, but product specifications govern |
| Spot price | Converts gamma to dollar exposure | Calculations can differ, per-$1 and per-1% figures are not interchangeable |
| Strikes and expirations | Defines the aggregation universe | Different filters produce different totals |
Dollar GEX Formula
Dollar GEX per 1% move = Γ × modeled dealer position × contract multiplier × spot² × 0.01
The GEX state is positive when estimated dealer inventory is long gamma and negative when it is short gamma. Long calls and long puts have positive gamma; short calls and short puts have negative gamma.
Worked GEX Example
Assume a $200 stock, unit gamma of 0.02, an estimated long-gamma dealer position of 1,000 contracts, and a 100-share multiplier. A 1% stock move is $2.
- Delta sensitivity per $1 move: 0.02 × 1,000 × 100 = 2,000 shares.
- Delta change for a 1% move: 2,000 × $2 = 4,000 shares.
- Dollar GEX: 4,000 × $200 = $800,000 per 1% move.
- Equivalent formula: 0.02 × 1,000 × 100 × $200² × 0.01 = $800,000.
If this position is long gamma and the stock rises 1%, a dealer may have to sell approximately 4,000 shares, or after a 1% decline buy about 4,000. A short-gamma position reverses the direction.
GEX per $1 Move vs. per 1% Move
Some charts report delta change for a $1 underlying move; others convert it to dollar notional for a 1% move. The spot² × 0.01 terms make the conversion. Traders and investors should always check the units before comparing values from two sources.
Why GEX Values Differ Across Providers
GEX is a model output, not an exchange-published statistic, this means two legitimate GEX charts can disagree. The main drivers of that difference:
- Position ownership convention: Determines which contracts contribute positive or negative exposure.
- Expiry and strike filters: Changes which inventory is included in the total.
- Spot and volatility timestamp: Changes option’s gamma and the aggregate profile.
- Per-$1 vs. per-1% units: Changes the reported scale of the numbers.
- Intraday-flow treatment: Changes whether today’s trades adjust prior-day open interest.
- Index, ETF, and futures netting: Changes how related hedges are represented.
How to Read a GEX Chart
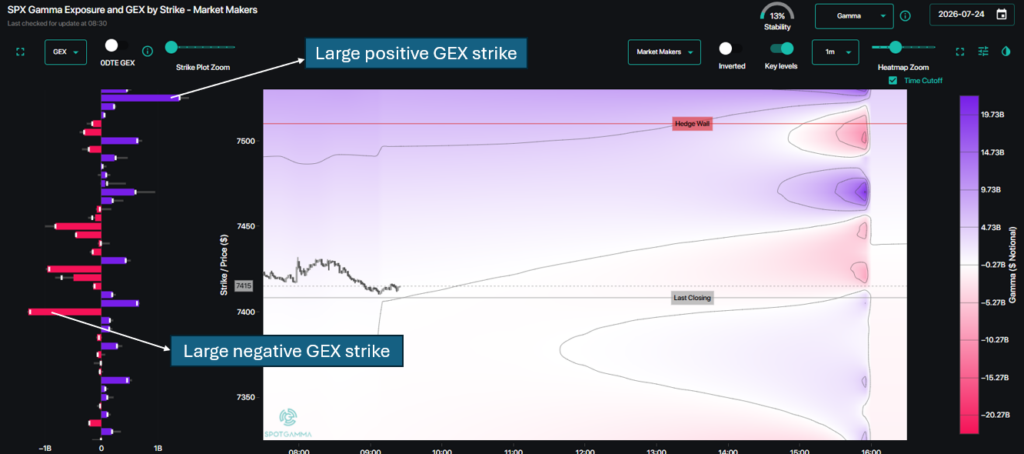
Reading gamma exposure in SpotGamma’s TRACE: the Strike Plot (bars) and heatmap (colour) together.
Below are specific steps to follow when reading a GEX chart, such as SpotGamma’s TRACE heatmap shown above:
- Identify the dealer gamma regime: Positive or negative net GEX helps you anticipate realized volatility for the underlying instrument.
- Understand the cumulative gamma map: If dealers hold larger amounts of gamma, that means their hedging impact may exert a more significant impact on price action.
- Locate strikes with large gamma concentrations: The strikes holding the largest amount of positive and negative bars often function as support & resistance levels.
Naive GEX Limitations
A basic gamma exposure model, which is built from the official open interest with a fixed rule for assigning position signs, is a widely used starting point for calculating GEX. While this makes asusmptions surrounding trader (and dealer) behavior, this provides a defensible daily snapshot for where gamma sits.
There are two primary imitations worth noting, which is what SpotGamma tools such as TRACE improves upon.
Official open interest is a prior-night snapshot
Open interest is published overnight and stays static through the session. Hedge positions and new trades change during the day, so a snapshot-only model can drift. A basic model still tells you where positioning started the day, whereas an intraday model estimates how it’s changing throughout the day.
Additionally, 0DTE options trades (which expire the same day they are traded) represent a massive share of all transactions: Cboe data reports that 59% of SPX options volume in 2025 came from same-day positions. Volume isn’t necessarily the same as net dealer exposure, but this statistic makes same-day coverage material to any intraday read.
Public OI doesn’t say who owns each side of a trade
Basic OI-based GEX assigns dealer or customer ownership by assumption, because public data doesn’t identify the holder. That convention is useful and can often be reasonable, but it’s still an assumption. SpotGamma’s Options Inventory Model (the engine behind TRACE and the Synthetic Open Interest model) determines positioning for each participant rather than defaulting to a single fixed rule.
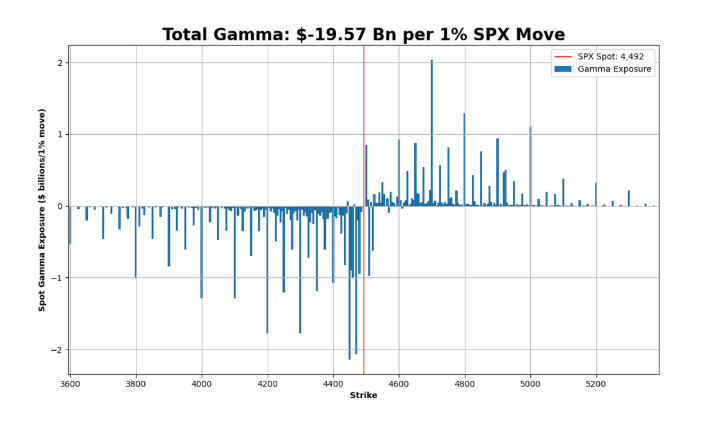
A basic Total OI model (top) versus SpotGamma’s TRACE (bottom). Both are useful for trading the S&P 500, however TRACE adds intraday flow, isolates 0DTE-specific activity, and estimates positioning by participant.
How SpotGamma Estimates GEX
SpotGamma’s models are built in layers. Each layer keeps what the previous one does well and adds further improvements on top. SpotGamma uses OPRA data, direct exchange feeds, and proprietary calculations; see where SpotGamma’s data comes from.
SpotGamma Tools for Understanding GEX
TRACE
TRACE is SpotGamma’s intraday options-flow and gamma-visualization product, built on a proprietary Options Inventory Model that updates every 1-minute modeling SPX options positioning. This informs traders of potential zones of support, resistance, and volatiltiy for the S&P 500.
TRACE displays a gamma heatmap and models GEX, open interest, and net open interest by strike. Additionally, TRACE features a delta pressure heatmap indicating the direction market makers must hedge across strike and time, and a charm pressure heatmap revealing how dealer hedging changes due to the time decay of oustanding options positions.
Synthetic Open Interest Model
SpotGamma’s Synthetic Open Interest model delivers industry-leading clarity into how the options market is exerting its hidden force on all US stocks and indices. Powered by the best market data available and proprietary SpotGamma analytics, the Synthetic Open Interest model delivers precise insights that can elevate your trading approach.
The Synthetic Open Interest model is found with SpotGamma’s Equity Hub, providing pre-market analytics for 3,500+ US-listed stocks, ETFs, and Indices.
Total Open Interest Model
Equity Hub’s Total Open Interest Model maps positioning across the entire options market for 3,500+ U.S. stocks — revealing the key levels where buyers and sellers are likely to step in, so you can structure trades with defined risk and avoid getting caught on the wrong side of the move.
Key Levels
SpotGamma’s key levels are based on SpotGamma’s Total Open Interest model, providing traders with specific price points that indicate support, resistance, or changes in volatility.
- Call Wall: The Call Wall identifies the strike with the largest call gamma, acting as overhead resistance as dealers who sold calls may need to sell shares of the underlying as price approaches this level.
- Put Wall: The Put Wall identifies the strike with the largest put gamma, serving as critical support as dealers who sold puts may need to buy shares of the underlying as price approaches this level.
- Volatility Trigger (Hedge Wall): The Volatility Trigger is a proprietary level above which to anticipate compressed volatility and calmer price action, and below which to anticipate expanded volatility and bearish feedback loops; the Volatility Trigger is derived from the distribution of gamma rather than strictly following the Gamma Flip level, and oftentimes acts as the last support level above the Put Wall.
- Gamma Flip (Zero Gamma): Zero Gamma is the spot price where aggregate GEX crosses zero, marking the point where dealer hedging activity may see a change in behavior as the gamma regime changes.
- Absolute Gamma Strike: The Absolute Gamma Strike holds the largest total gamma, and often serves as a strong level of support and resistance; this level often functions as an inflection point, typically near the Zero Gamma level.
Where GEX Fits in Market Analysis
GEX is most useful as a scenario and risk-management tool alongside price, implied volatility, liquidity, events, and live flow.
Intraday and 0DTE context
Compare spot with modeled concentration levels, then define what would confirm or invalidate a range, breakout, or reversal scenario.
Swing-regime context
Changes in aggregate gamma can help frame whether realized volatility may be more compressed or more sensitive to an initiating move. Use the regime as a conditional input to assist when executing and managing trades.
Portfolio scenario planning
Portfolio managers can incorporate GEX levels into stress tests, hedge-review thresholds, and position-size decisions.
What GEX can help with
- Volatility context across strikes and expirations
- Important strikes and crossover regions
- Scenario design and risk invalidation
- Comparing how exposure changes through time
What GEX cannot prove
- The market’s next direction
- Exact dealer inventory
- The timing or size of a specific dealer’s hedge trade
GEX Across Indices, ETFs, Futures, and Single Stocks
The interpretation of GEX is similar across products. However, contract specifications, liquidity, participant mix, and related hedges matter. Do not compare raw GEX values across SPX, SPY, QQQ, IWM, futures, or individual equities without normalizing units and methodology.
- SPX: Cash-settled index options with heavy daily and 0DTE activity.
- SPY, QQQ, and IWM: ETF options with deliverable shares and a different participant and hedge mix.
- ES futures: A common index-hedging vehicle; an options GEX model does not directly observe every futures hedge.
- Single stocks: Individual equities have vastly different amounts of options trading and subsequent dealer gamma exposure; earnings, corporate actions, and concentrated flow can dominate a static gamma map.
Get Access: Start Trading With the Full GEX Picture
Every SpotGamma plan includes the Total OI Model and key levels for 3,500+ US stocks, ETFs, and indices, alongw ith the daily Founder’s Note and live options data via Tape. In addition, we support our community with multiple weekly sessions providing market analysis and education, along with an engaged Discord community.
Essential Membership
For active traders who want the key GEX levels and daily market structure briefing.
- Daily Founder’s Note (AM + PM)
- Key Levels: Call Wall, Put Wall, Zero Gamma, Volatility Trigger
- SPX/SPY/QQQ/IWM GEX charts
- Equity Hub – Proprietary daily GEX Gamma Exposure for +3,500 stocks
- Options Calculator
- Education Library
- Tape: real time options prints in +3,500 stocks
- Multiple live training sessions each week
Alpha Membership (Most Popular)
For intraday, options, and futures traders who need the deepest, real-time GEX & 0DTE data.
- Everything in SpotGamma Essential
- TRACE: Intraday SPX GEX updated every 1-minute
- 0DTE strike plot and key levels
- Charm & Delta Pressure heatmaps
- Synthetic OI Model: Proprietary GEX calculation 3,500+ names
- HIRO: Real-time hedging impact for options-driven stocks, ETFs, and indices
- Advanced Volatility Dashboard
Trusted by thousands of traders, you can see plans at spotgamma.com/subscribe.
Gamma Exposure FAQ
What is gamma exposure in simple terms?
Gamma exposure estimates how quickly the combined delta of modeled dealer option positions may change when the underlying price moves. It helps to describe potential hedge-rebalancing pressure and volatility sensitivity based on anticipated options market dealer behavior. This shows traders where support, resistance, and volatility may show up.
What does GEX measure?
GEX aggregates estimated option gamma over selected strikes and expirations. Providers may report share sensitivity per $1, dollar exposure per 1%, or another normalized unit, so the chart’s specific methodology may vary.
How is gamma exposure calculated?
A common per-1% formula is gamma × modeled dealer position × contract multiplier × spot² × 0.01, aggregated across the included options. The inventory sign is observed only if a provider has reliable participant-side data; otherwise it is estimated.
Is GEX measured per $1 move or per 1% move?
Both conventions can exist. A per-$1 figure measures delta sensitivity to a one-dollar move. Multiplying by spot and 0.01 converts that sensitivity to a 1% move; multiplying by spot again expresses the resulting underlying change as dollar notional.
What is positive versus negative dealer gamma?
Positive dealer gamma can produce counter-trend dealer hedging activity, which is selling after price rises and buying after price declines. Negative dealer gamma can produce pro-trend hedging, which is buying after price rises and selling after price declines.
Does GEX predict market direction?
No. GEX alone can indicate how an initiating move might be attenuated or exacerbated if dealers rebalance, but it does not identify whether the initiating move will be higher or lower.
What is the Gamma Flip or Zero Gamma level?
It is the modeled underlying price at which aggregate GEX crosses zero. The level is recalculated over hypothetical spot prices and changes with inventory assumptions, volatility, time, and included options.
What are the Call Wall and Put Wall?
They are modeled strikes with major call or put related concentration. The Call Wall is a strong level of resistance, while the Put Wall serves as the lowest major level of support. Traders can use them as scenario references to either trade from, or manage risk.
Why do GEX providers publish different values?
Providers can use different ownership assumptions, expirations, volatility inputs, spot timestamps, multipliers, intraday adjustments, and output units. GEX is a model result rather than an official exchange statistic.
Can public open interest reveal actual dealer positions?
No. Open interest shows how many contracts remain open, not which participant holds each side or whether positions are hedged elsewhere. Dealer positioning must be estimated unless participant-side data is available.
How often does GEX update?
A basic OI model updates after official overnight open interest is published. Intraday products may estimate changes from live trades, such SpotGamma’s TRACE featuring one-minute updates based on SPX options activity.
How do 0DTE options affect gamma exposure?
Near-expiry at-the-money options have the highest gamma, so same-day positions may change an intraday exposure map quickly. Note that high 0DTE volume does not, by itself, reveal net dealer exposure or prove a large market impact.
What is the difference between options GEX, DEX, vanna, and charm?
GEX focuses on delta change from underlying-price moves. DEX summarizes directional delta exposure. Vanna measures delta sensitivity to implied volatility, and charm measures how delta changes as time passes. Each describes a different potential way that dealer hedging may change as price, time, and implied volatility shift.