We are excited to share how the SpotGamma Dark Pool Indicator is providing insights relative to off-market stock purchases. We have analyzed many stocks and chose to share an example of a stock with fairly average returns over the past year: There appears to be a clear takeaway that, historically, stocks tend to outperform following five consecutive days when the SpotGamma DPI is above 45.
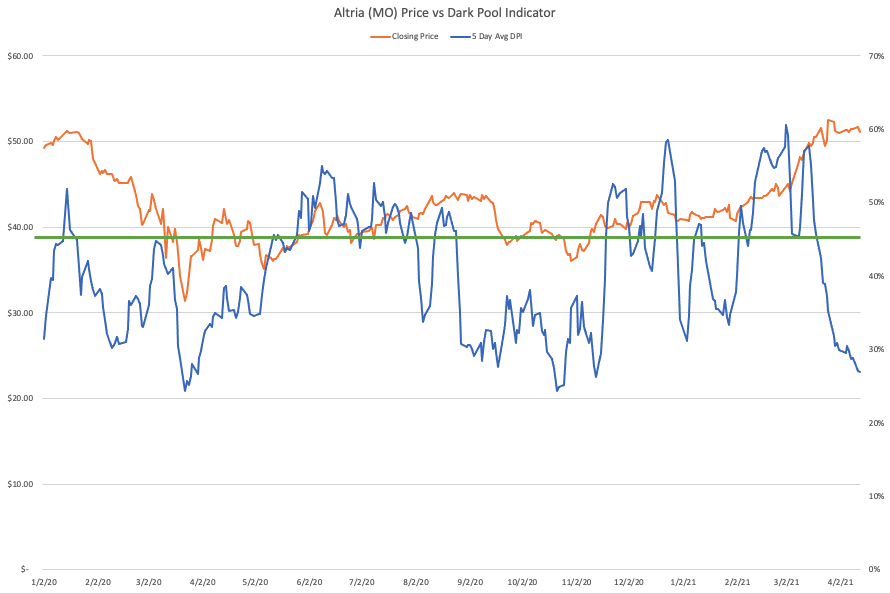
One strong example over the past six months is Altria (ticker: MO). To illustrate this example we are including a chart and a table.
In the chart, below we’ve plotted three key lines:
- The Stock’s Closing Price: Blue line.
- The 5 Day SpotGamma Dark Pool Indicator: Orange line. We use a 5 day average to show consistent buying in Dark Pools.
- The DPI above 45: Green line.
The statistics show that across stocks when the DPI is >45, the forward returns in equities are more positive than average returns.

To further reinforce this finding, we are providing a data table of the Atria returns over the past three years. You can see that there is a significantly higher return following periods with a DPI that is above 45. Additionally, when the 5 day average DPI is below 30, the stock underperforms by a wide margin.
| 5 Day Avg Return | 20 Day Average Return | |
| All days | -0.2% | -0.8% |
| 5 day average DPI >45 | 0.4% | 1.5% |
| 5 day average DPI <30 | -0.6% | -1.8% |
This is one of many reasons why Dark Pool metrics and the SpotGamma DPI should be considered and can be applied to an overall investment strategy.
