• Skip to main content
  • Skip to primary sidebar

SpotGamma™

S&P 500 Stock Market Gamma Trading Levels Based on Options Open Interest

  • About
  • Pricing
  • Academy
  • Resources
    • Tool Demos
    • Case Studies
    • Blog
    • Support Center
    • Daily Report
    • Free Trading Tools
      • Opening Setup Free Report
      • Options Profit Calculator
      • SPX Gamma Exposure
      • Implied Earnings Moves
    • Free Training
    • Report Card
  • Login

Feb 14 2020

Feb 12 – Absolute Gamma Bounce

ES Futures moved sharply lower overnight on 2/12-2/13 as fears of the Coronavirus moved higher. This created selling pressure which went unchecked until markets hit the key 3350 level. Its at this level which we measured the highest level of “Absolute Gamma” which the absolute value of call gamma + put gamma. We also calculated that the market was long roughly $1.5 billion in gamma at the 3350 lows – a number which generally supports a “bounce” in markets after a selloff.
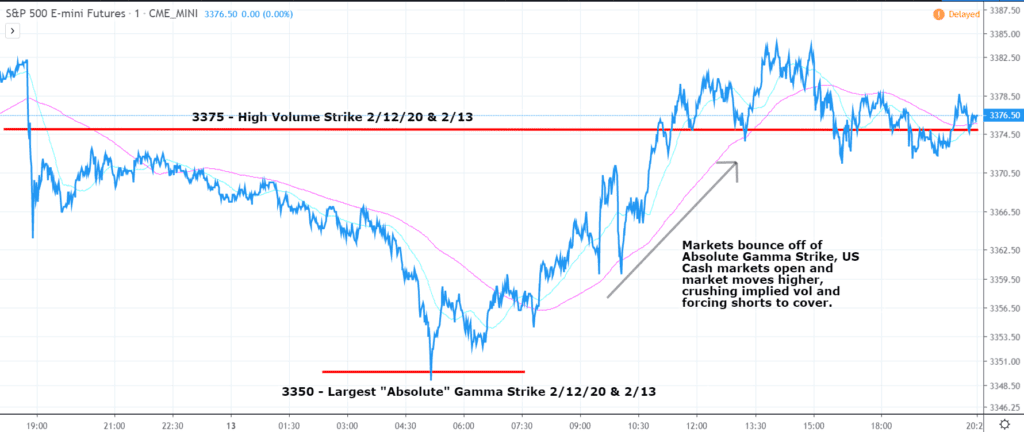
2/12/20 - 2/13/20 ES Futures Chart Showing Key Gamma Options Levels
2/12/20 – 2/13/20 ES Futures Chart Showing Key Gamma Options Levels

We think the Absolute Gamma level is notable because it is a level at which many large positions exist, and there should be both large hedging activity and high option volumes tied to that strike. This may cause this level to function as support or resistance as seen in the chart above.

Below is our subscriber chart which outlines stock market gamma exposure and key trading levels. You can see that 3350 was highlighted as a key level heading into the overnight session.
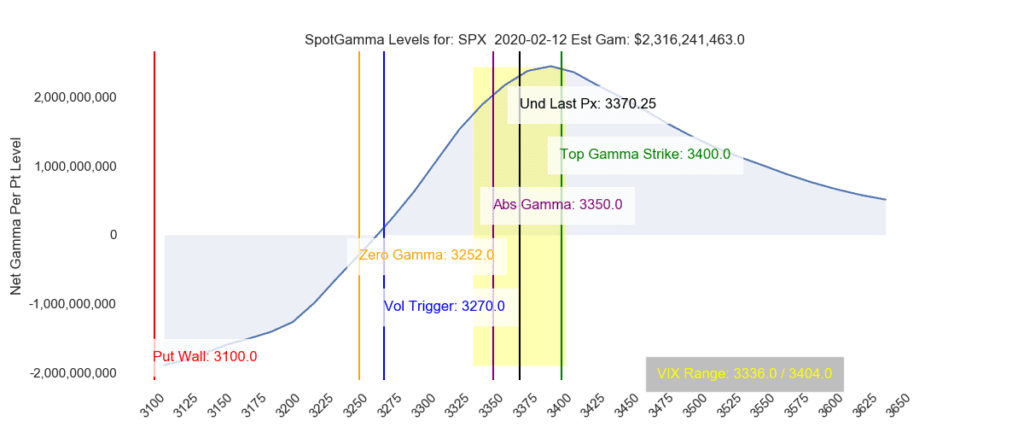
SpotGamma SPX Gamma Options Chart from 2/12/20

Share This Article

  • Share
  • Twitter
  • LinkedIn
  • Reddit
  • Facebook

Written by tenten · Categorized: Market Analysis · Tagged: absolute gamma, coronavirus, market selloff

Don’t have an account with SpotGamma?

Choose the plan you want today to view unique support and resistance levels, access Founder’s Notes and expert commentary, daily trading ranges, and entrance into our private Discord.


Primary Sidebar

Related Resources

  • CYTK: A $390K Options Bet Targets November FDA Catalyst

    CYTK: A $390K Options Bet Targets November FDA Catalyst

    October 14, 2026
  • Why Option Premiums Look Too Thin To Sell

    Why Option Premiums Look Too Thin To Sell

    October 14, 2026
  • CPI Meets Positive Gamma: The SPX Levels That Could Determine the Next Move

    CPI Meets Positive Gamma: The SPX Levels That Could Determine the Next Move

    October 12, 2026
  • The OPEX Effect: Put Selling Is Still Doing The Work

    The OPEX Effect: Put Selling Is Still Doing The Work

    October 12, 2026
  • Banks Look for an Earnings Bounce Ahead

    Banks Look for an Earnings Bounce Ahead

    October 11, 2026
  • youtube
  • x
  • Privacy Policy
  • Disclaimer
  • Terms & Conditions
  • Support Center
  • Media
  • Contact Us

©2026 TenTen Capital LLC DBA SpotGamma

All SpotGamma materials, information, and presentations are for educational purposes only and should not be considered specific investment advice nor recommendations. Futures, foreign currency and options trading contains substantial risk and is not for every investor. An investor could potentially lose all or more than the initial investment. Risk capital is money that can be lost without jeopardizing one's financial security or lifestyle. Only risk capital should be used for trading and only those with sufficient risk capital should consider trading. Past performance is not necessarily indicative of future results. Testimonials appearing on this website may not be representative of other clients or customers and is not a guarantee of future performance or success.

View Full Risk Disclosure