looking for clear, insightful analysis on what's really driving markets?
Where options flow the markets go
available now: compass
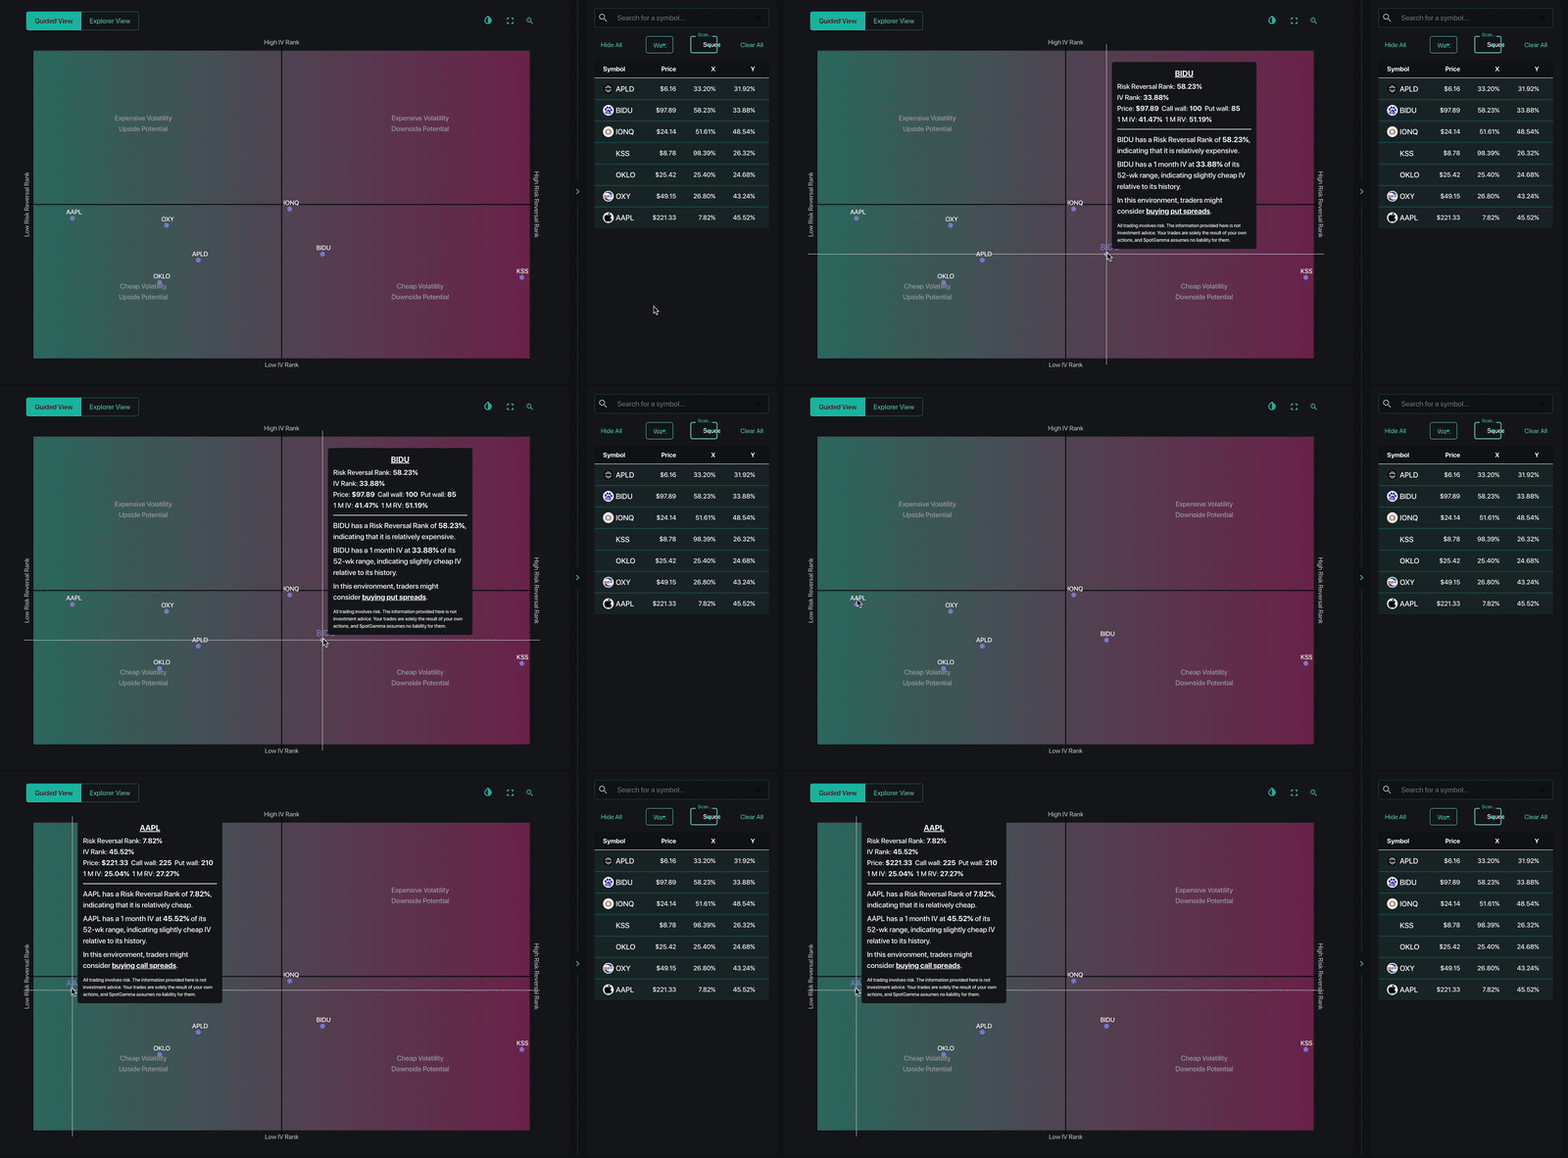
The all new Super Scanner for unveiling directional + volatility signals in seconds
Trusted By Top Institutions
Daily Options Flow Analysis
Unique Levels on US Indices
Key Levels on 3,500+ US Stocks
Real-Time Charts & Indicators
Options Education Courses
Directional Guidance
Everyday Traders and World-Class Experts Love Using SpotGamma
See for yourself...
"I signed up for the monthly plan last night, and my trade this morning just paid for an upgrade to the annual plan. I'm all in!"
- Nick F.
"Beyond a shadow of a doubt your AM and PM Founder's Note has the greatest value to me in determining how I trade the day. SpotGamma has increased my ability to trade with a much higher level of success."
-Philip W.
"Cannot tell you guys enough how you have changed the way I trade…and I don’t use 90% of your tools! Service is worth 10x the cost!"
- Christopher R.
So, Why Options Flows?
Trying to forecast stock market movement without paying attention to the impact of options flows is like trying to build a sandcastle on the beach with a blindfold over your eyes.
That's Where Options Flow and "Positional Analysis" Comes In.
Positional analysis is like a "financial lifeguard" pointing out all the best spots to build so you can stay informed of what's really going on in the markets, and make informed trading decisions.
Positional Analysis is the Secret to Your Trading Edge
Hedge funds have known about the power of the options market for years, but only recently did access to this institutional data become available to the public.
🤷♂️ Without Positional Analysis
😎 With Positional Analysis
SpotGamma lets You access the same proprietary real-time options flow data that the pros use
"Whenever I trade without looking at the options flow first - I regret it!"
founder's note
Key Levels & Commentary
Straight from the founder: actionable trading intelligence
equity hub
3,500+ Stocks & Indices
Evaluate stock entry points based on options analysis with Total OI & Synthetic OI Lens
compass super scanner
Pinpoint Setups
Pinpoint Setups
Scan for directional + volatility signals in seconds
TRACE
HEATMAP
S&P 500 Real-Time Heatmap
S&P 500 Real-Time Heatmap
Identify key zones of support, resistance, and volatility
hiro
INDICATOR
Real-Time Indicator
See options trades impact the markets down to the second
VOLATILITy
DASHBOARD
Market Volatility & Extremes
Market Volatility
Understand market sentiment & identify options mispricing
tape
options flow
market-moving trades
market-moving trades
Spot impactful options trades across 3,000+ tickers instantly
Join SpotGamma Today To See What The Professionals See
Frequently Asked Questions
What is included in each SpotGamma subscription level?
SpotGamma has three plans available for subscribers: Standard, Pro, and Alpha. All plans come with access to the SpotGamma Dashboard, twice-daily Founder's Notes from Brent and the SpotGamma team, subscriber Q&As, and unique key levels for the major US Indices. The Pro plan gives you access to Equity Hub, with key levels for over 3,500 stocks and ETFs, and Alpha gets you access to HIRO, our real-time options indicator, the Volatility Dashboard, and our S&P 500 heatmap app, TRACE.
I already trade on my own platform, what integrations does SpotGamma have?
SpotGamma key levels integrate seamlessly with the following futures trading platforms: TrendSpider, Bookmap CloudNotes, NinjaTrader, Jigsaw, eSignal, Sierra Chart, TradingView, ThinkorSwim, and EdgePro.
Does SpotGamma help with 0DTE trades?
The short answer is absolutely. 0DTE is a term used to describe options which expire in a very short amount of time. Here's a whole page full of articles and analysis on 0DTE options.
What are the SpotGamma proprietary key levels?
To get a snapshot of all SpotGamma key levels, head to the helpful and comprehensive Support Center where we cover all things SpotGamma levels.
