**Access to a full list of stocks with estimated IV Rank impact is available at the end of this article**
SpotGamma Models Reveal IV Rankings for OPEX Trading + Analysis
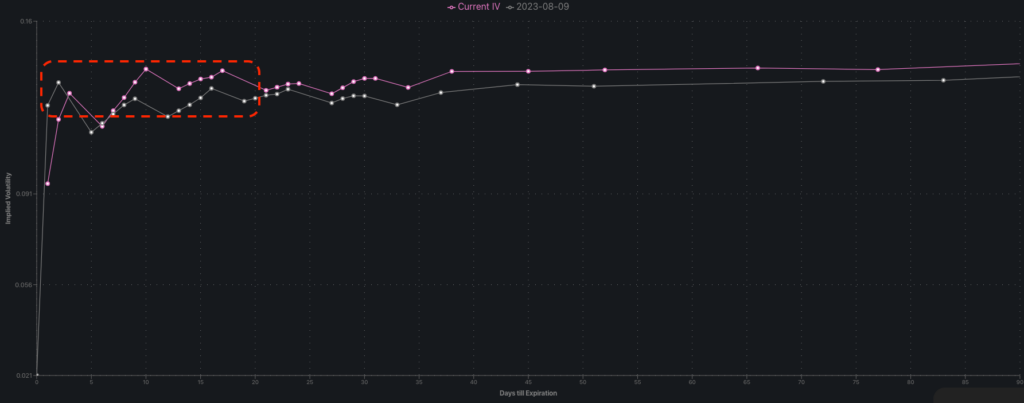
Despite the 3% decline in the S&P 500 over the month of August, both S&P 500 realized volatility and implied volatility has remained muted.
“Market down, volatility down/flat” is NOT something we are used to seeing!
This lack of shift in implied volatility is exhibited by the SPX term structure, shown below.
What about VIX?
If the reduction of options positions with expiration leads the SPX to break below 4,400, we may see a meaningful increase in volatility, with the VIX quickly moving to 20.
The other surprising factor when reviewing this expiration is the low level of implied volatility present in most stocks.
To this point, the free options expiration spreadsheet, available at the end of this article, shows that the average IV Rank (measuring current 1 month at-the-money implied volatility vs those similar levels over the last year) into August OPEX is only 17%, suggesting that most stocks are priced for little movement going forward.

What’s the implication for August OPEX and into September expiration?
The expiration of large Gamma positions may be a catalyst for volatility as we head into September. Particularly in the single stock space, the demand for long options positions (either calls or puts) could lead to an increase in single stock volatility.
OPEX Mechanics
Many monthly options expirations occur into major stock market moves. When the market has strong rallies, it creates imbalances in the relative size of put & call positions. Market rallies increase the value of stocks, which drives the values of calls higher. Conversely, market drops raise the value of puts.
When expiration occurs, large call positions are removed and hedging flows must adjust to new, relatively smaller levels of options exposure.
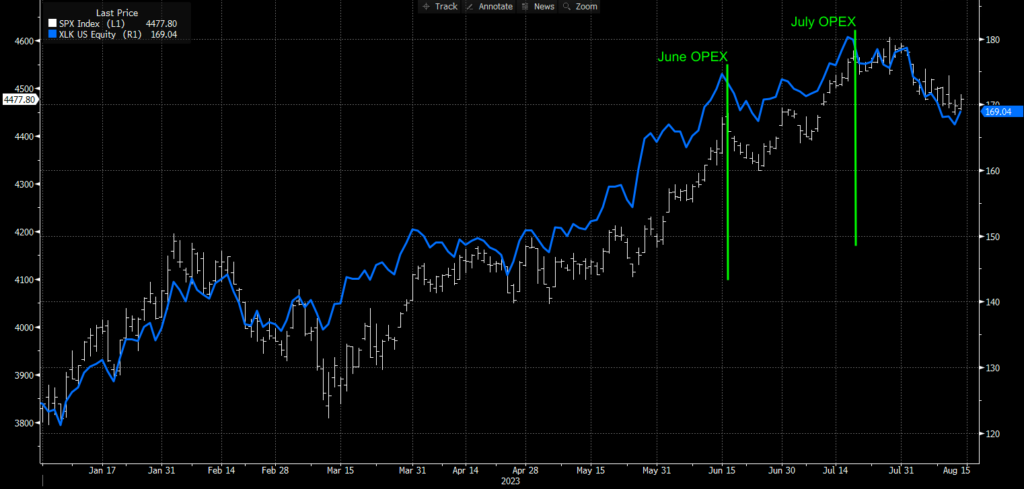
In June & July of ’23, equities were ramping to fresh highs +15-20% for the year.
As you can see below, there was relative equity market weakness immediately following the June and July options expirations, wherein the S&P 500 had rallied +15% YTD.
This was particularly true in the tech sector (XLK tech ETF, blue line), which had a particularly strong advance into expiration(s) as investors rallied behind the AI narrative.
This led the XLK tech ETF to a notable 2023 return of +45% YTD into July.
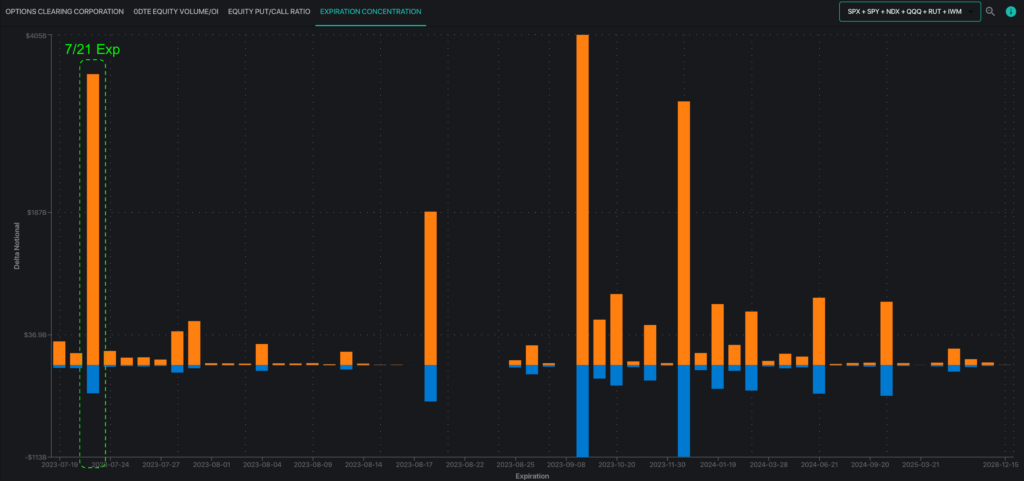
The imbalance that resulted from the 1H ’23 market rally is graphed below, which depicts the size of call delta (orange) vs put delta (blue) for July expiration.
As you can see the value of call positions far outweighed that of puts since equity markets rallied so sharply.
By contrast, this type of call-heavy imbalance is not present in August expiration, as stocks have consolidated following the call-heavy July expiration.
As you can see not only are the call and put positions roughly equal, the size of the overall expiration is much less than that of September expiration.
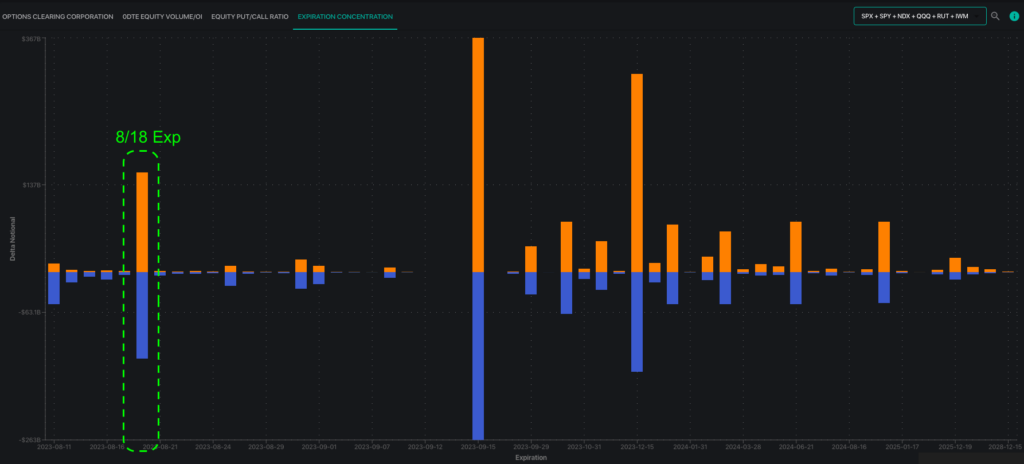
The result of this is that on the Index side we do not measure a major directional impact from Friday’s equity expiration, but the reduction of at-the-money options positions could lead to equity prices unpinning and larger directional moves.
We’re pinned in a neutral zone, and OPEX may release us from that zone.
How do you trade on options expiry?
Based on the factors outlined above as well as idiosyncratic stock positioning, we present the following 3 OPEX-powered trade ideas.
Neutral to Bullish: DOCU
Overview: DocuSign, the facilitator of electronic signatures, has struggled to regain the $50 level after declining 10% from July OPEX. Further, its struggled to rally despite strength in the overall tech sector.
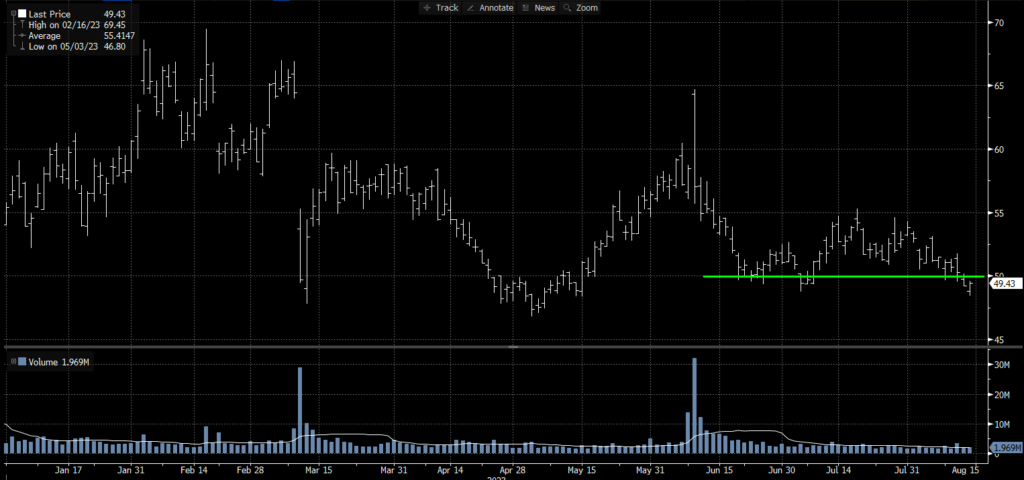
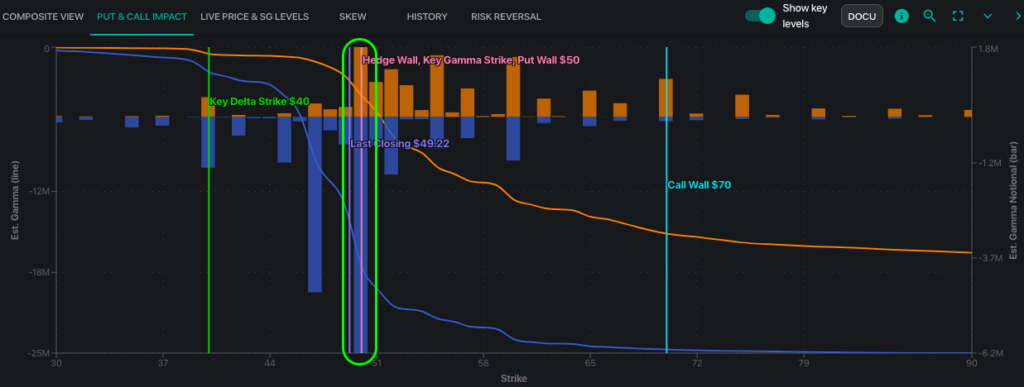
Tied to this key level $47.5-50 area is are large put position(s), as our Equity Hub shows, below (puts in blue, calls in orange).
DOCU has 25% of its total Put Gamma expiring on Friday, and we believe this may alleviate some of the hedging flow which is holding the stock lower.
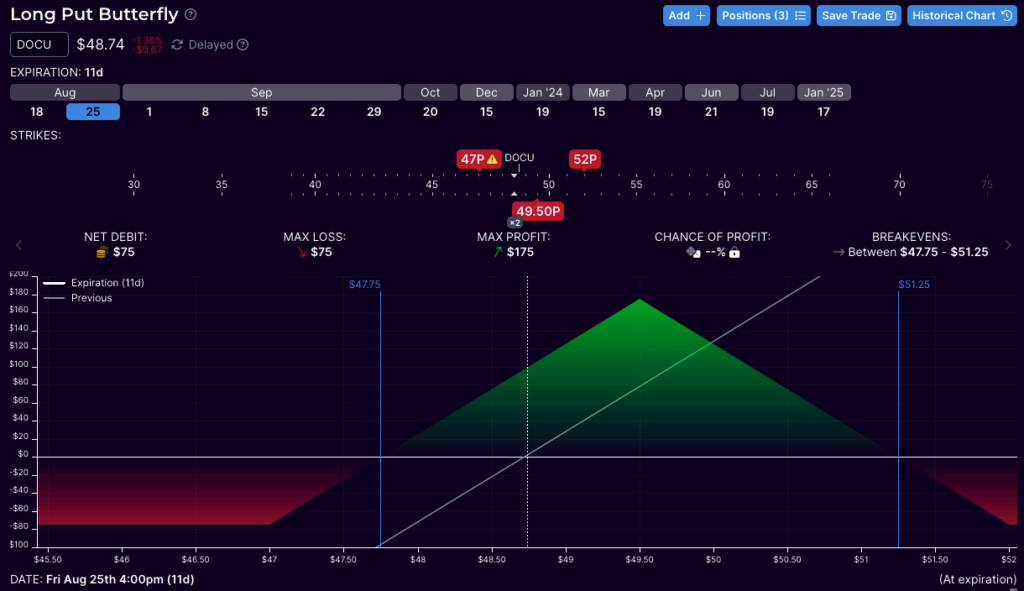
DOCU is likely to report earnings on Sep 1st, and so we look to structure a pre-earnings put fly that profits if the stock closes >47.5, but under 51.50 for August 25th expiration.
Bearish: RCL
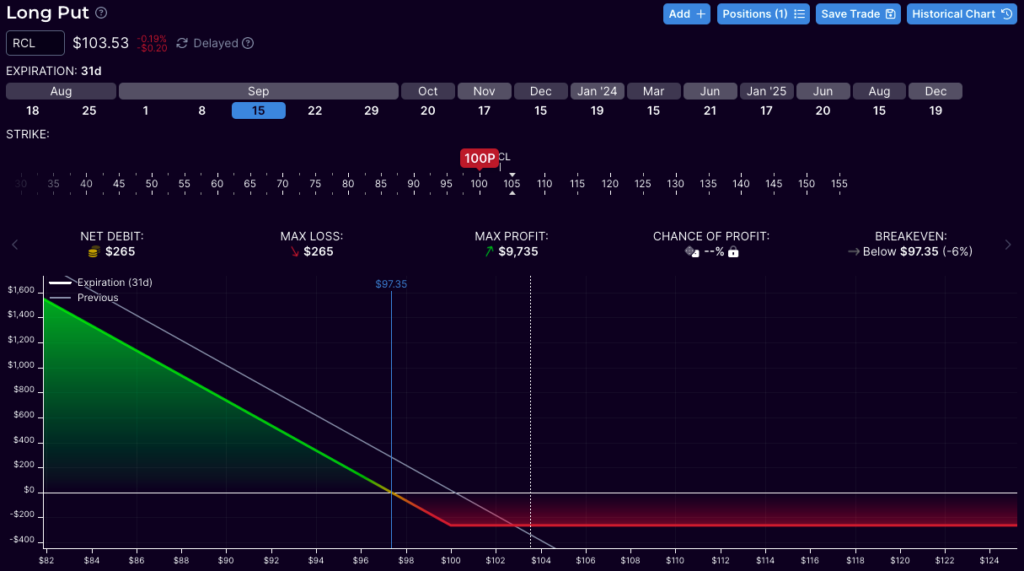
Overview: Royal Caribbean Cruise Lines is +111% YTD, and it now has an IV Rank of 1%. It recently breached its $95 Call Wall, with 30% of its total Gamma position set to expire on Friday, August 18th.
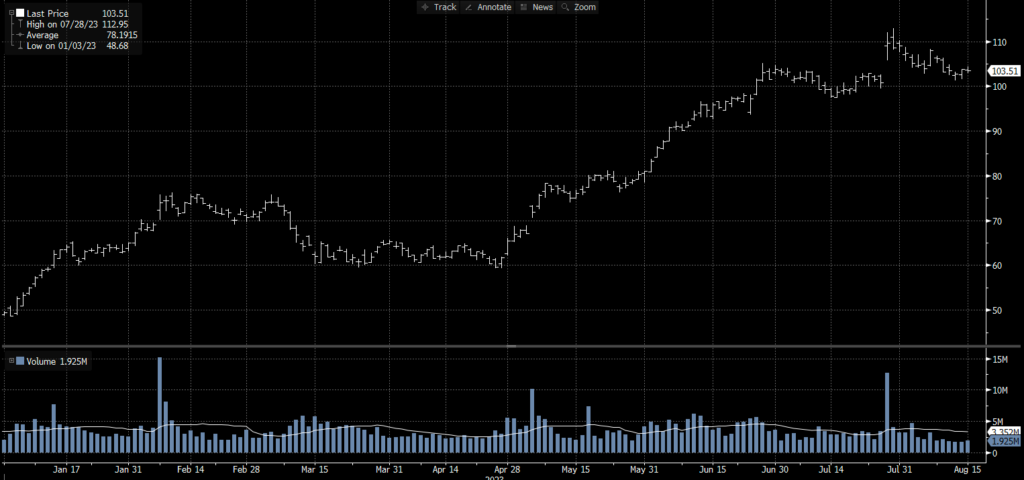
Further, our key levels have failed to roll higher despite the increase in the stock’s price. This is a signal that the options market is not looking for further upside.
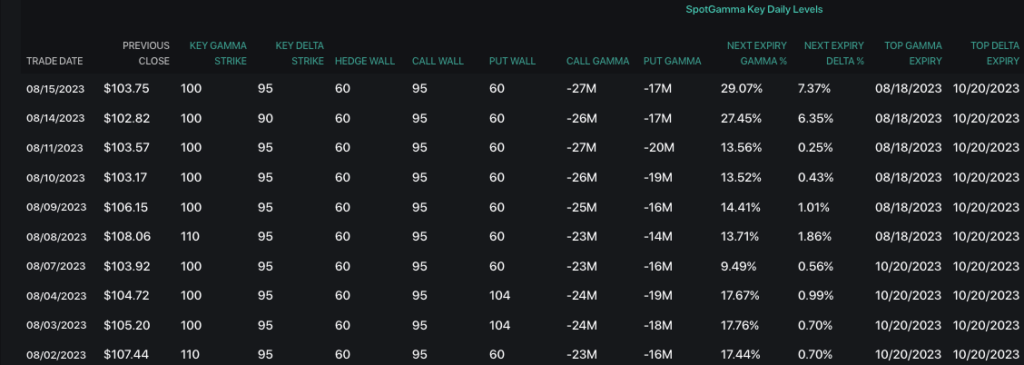
Due to the low IV, and removal of at-the-money options positions, it might be interesting to look at a basic long put position in RCL.
Long Volatility: AAPL
Overview: AAPL is down ~8% since the start of August, after reporting lackluster earnings. This move appeared to have broken a major trend higher in the stock, which had persisted since the start of ’23.
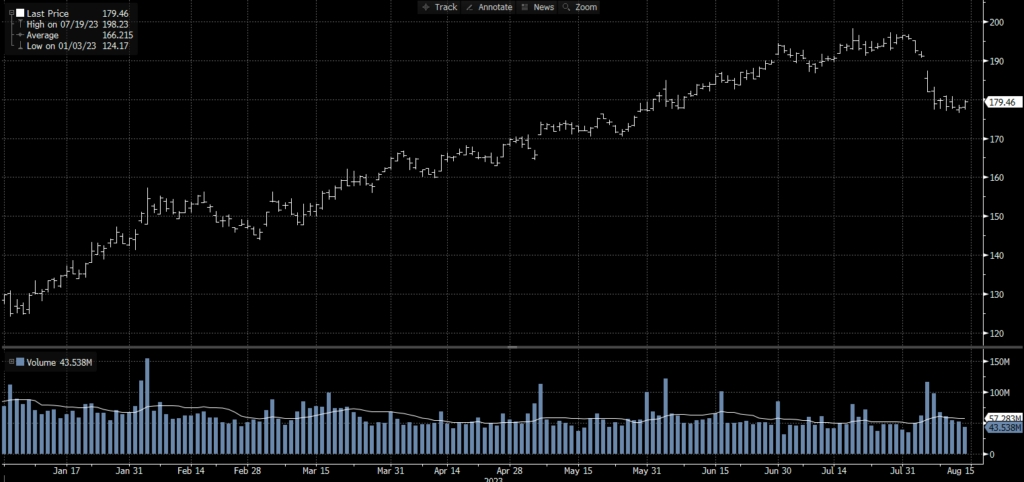
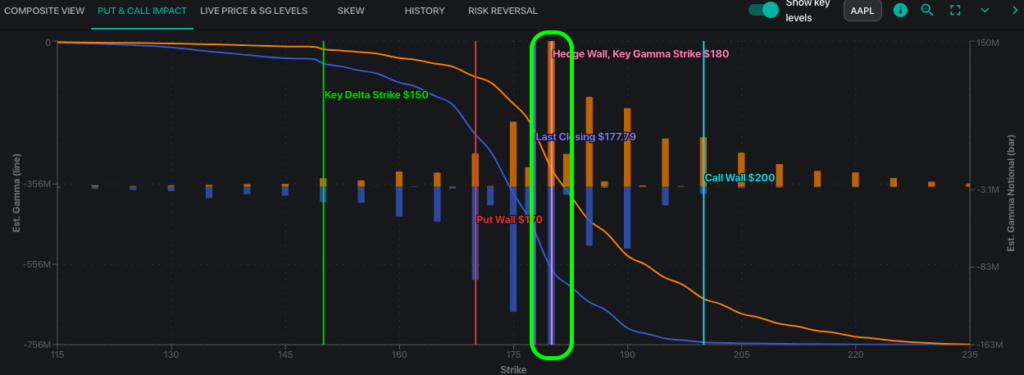
The decline appears to have been “caught” by large put positions which have filled in at the 170 & 180 strikes. As you can see in our plot of Gamma by trike below, 180 is the largest options strike on the board, and a level which has been sticky for AAPL over the last several sessions.
28% of this total Gamma is going to be removed with Friday’s expiration.
Despite this decline, traders did not appear to position themselves into long put positions. This is seen through our Risk Reversal metric (purple), which measures the IV of a one month AAPL call, vs a similar put.
As you can see this metric has been stable throughout AAPL’s decline, implying that there was not large long put demand as that would have led to a sharp decline in this metric.
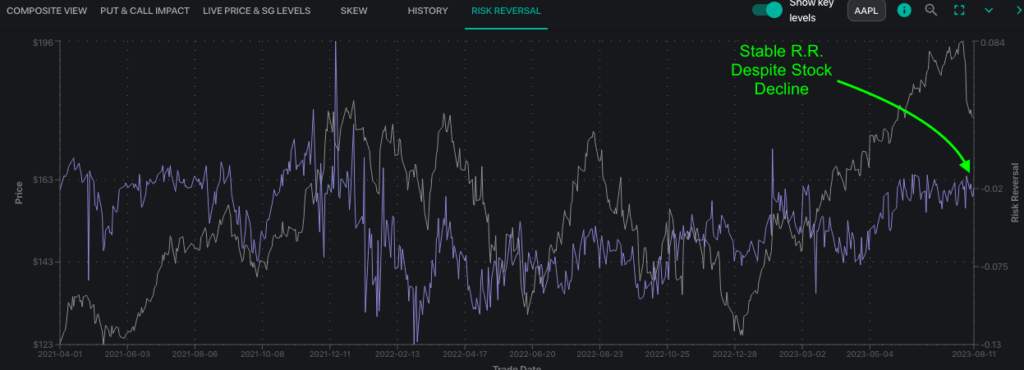
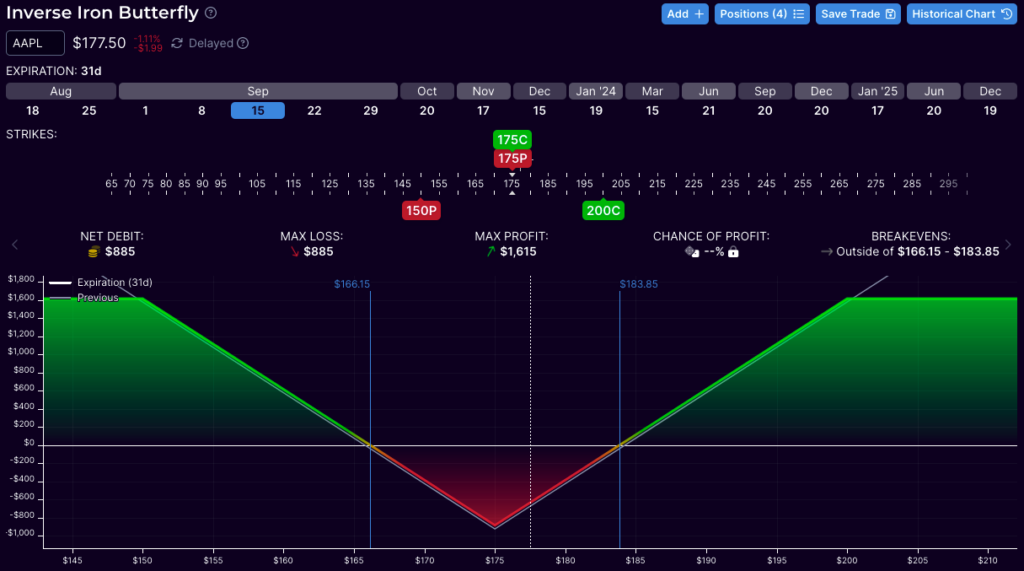
The removal of large Gamma at the $180 strike may release the stock from this level. Further, due to the low IV Rank, long options positions may be favorable.
For these reasons we look at a Sep ’15 inverse iron butterfly, as shown below.
The Full List of Names
SpotGamma has compiled an expiration spreadsheet, which shows a full list of stocks with estimated IV Rank impact, measuring current 1 month ATM Implied Volatility vs. similar levels over the last year.
A special thanks to optionstrat.com for the PNL diagrams.
