• Skip to content
  • Skip to primary sidebar

SpotGamma™

S&P 500 Stock Market Gamma Trading Levels Based on Options Open Interest

  • Subscribe Now
  • Products
  • Blog
  • FAQ
  • Contact
    • About
  • Members
    • Account
    • Portal
    • Equity Hub 2.0

Combo Strike

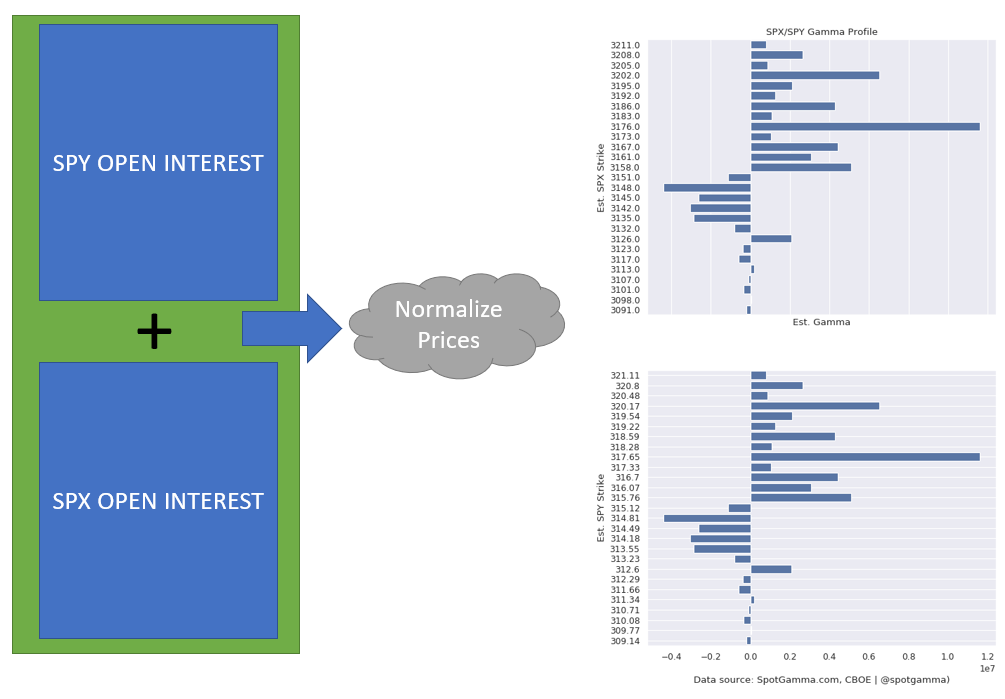
The Combo Strike simply takes all the SPX OI and combines it with all of the SPY OI. The two should be similar, but there is generally a price difference between levels. For example 3100 in the SPX does not precisely equal 310 in the SPY. So after aggregating the open interest we back out what the equivalent price is in both SPX and SPY terms.

SPX SPY Options Gamma

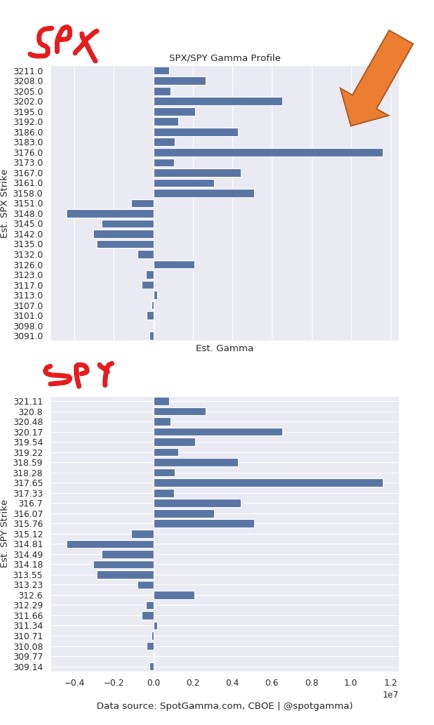
The larger the bar is on the graph, the more gamma is associated with that price. Large “right” bars (orange arrow below) are positive gamma support/resistance lines. Large “left” bars are negative gamma points. These levels have been showing as strong support and resistance lines. The chart at top shows SPX prices, SPY is the bottom. If you are trading ES you need to adjust the SPX level to the ES price.

  • Click to share on Twitter (Opens in new window)
  • Click to share on Facebook (Opens in new window)
  • Click to share on LinkedIn (Opens in new window)
  • Click to share on Reddit (Opens in new window)

Primary Sidebar

Popular Posts

spotgamma-sidebar-weaponized-gamma-sidebar
spotgamma-sidebar-yolo-trade
did-softbank-weaponize-options-gamma-whale
goldman-gamma-op-ex-option-driven-equity-flow
spotgamma-on-the-market-huddle

Categories

  • Market Analysis (258)
  • SpotGamma Updates (4)
  • Stock (47)
  • Trade (3)
Follow @spotgamma on Twitter!
  • Subscribe
  • Disclaimer
  • Account
  • Portal

©2021 TenTen Capital LLC DBA SpotGamma