• Skip to main content
  • Skip to primary sidebar

SpotGamma™

S&P 500 Stock Market Gamma Trading Levels Based on Options Open Interest

  • About
  • Pricing
  • Academy
  • Resources
    • Tool Demos
    • Case Studies
    • Blog
    • Support Center
    • Free Daily Report
    • Free Trading Tools
      • Options Profit Calculator
      • SPX Gamma Exposure
      • Implied Earnings Moves
      • Volatility Ranking
    • Free Training
    • Report Card
  • Login

Aug 13 2020

CSCO Earnings Crash – a Prediction

We’re positing up a live example of using our Equity Hub data. CSCO disappointed in earnings today, and is currently down 10%. Here is a snapshot of our data from preopen which shows the largest concentration of options at the 50 strike. The most puts are at 40, which we think might function as a bottom. Its 10AM EST now, we will update this at the close. (NOTE: Updated Chart at Bottom)

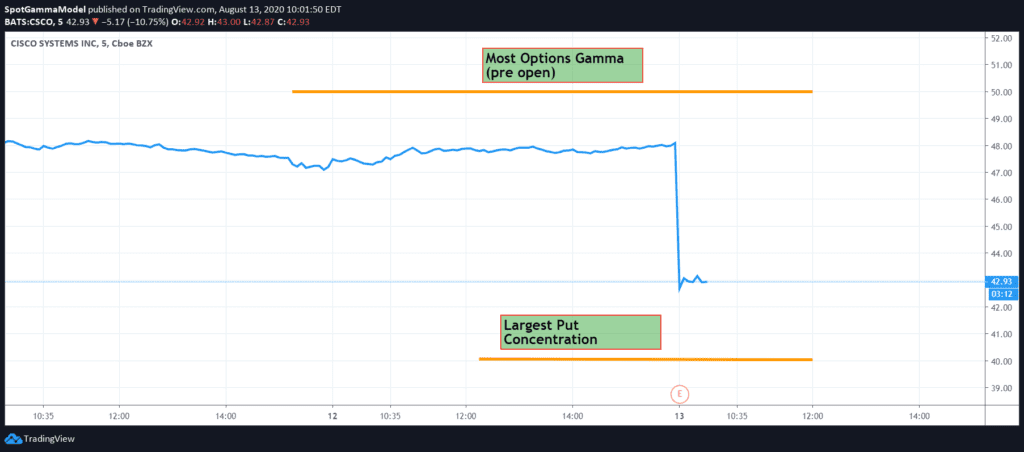
SpotGamma Equity Hub CSCO Options Data
CSCO price chart with SpotGamma put wall and high gamma levels

Looking at our Gamma map you can see that there was a lot of fuel for volatility based on the steepness of the call and put gamma (blue and orange lines) – we marked this with red arrow. That gamma flattens out under 40. Because the bulk of this interest doesnt expire until 8/20 (>1 week) we think that there is enough pull in the 50 strike options to possible reel this name back in. We also think that 40 strike put positions would be closed here to take advantage of the ~10% drop.

Based on this we think odds are for CSCO to bottom around this 42.50 level.
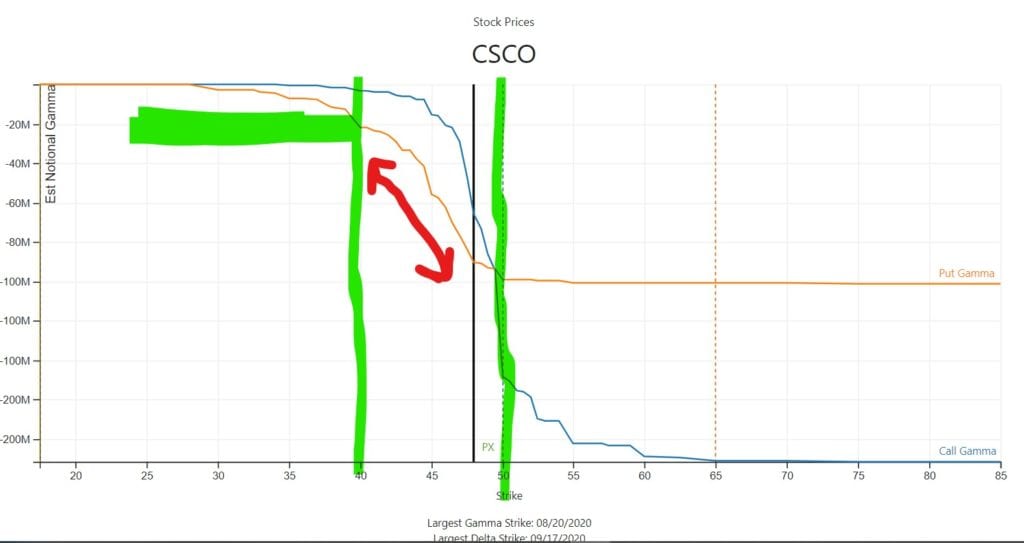
CSCO Options Gamma Chart

8/14/20 AM Update

Our idea was that CSCO may find a bottom around $42.50 due to how options were positioned, and so far thats been the case. We will update this chart later today, too.
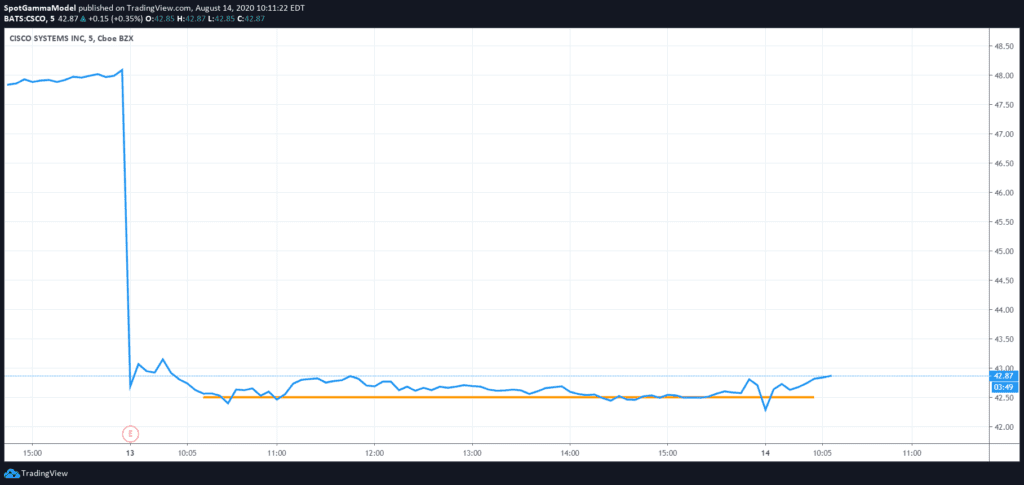
8/25/20 Update

CSCO has been tied to this 42 level since our previous post.

CSCO Stock Chart TradingView

Share This Article

  • Share
  • Twitter
  • LinkedIn
  • Reddit
  • Facebook

Written by SpotGamma · Categorized: Market Analysis, Stock

Don’t have an account with SpotGamma?

Choose the plan you want today to view unique support and resistance levels, access Founder’s Notes and expert commentary, daily trading ranges, and entrance into our private Discord.


Primary Sidebar

Related Resources

  • AI Infrastructure Runs Hot into September

    AI Infrastructure Runs Hot into September

    September 7, 2026
  • Doves Fly into August Jobs Report

    Doves Fly into August Jobs Report

    September 3, 2026
  • AI Stock Options Reset From a Record Peak: Brent Kochuba on tastylive

    AI Stock Options Reset From a Record Peak: Brent Kochuba on tastylive

    September 3, 2026
  • How Options Positioning Could Limit a Major Selloff

    How Options Positioning Could Limit a Major Selloff

    September 2, 2026
  • Broadcom is the Next AI Focused Catalyst

    Broadcom is the Next AI Focused Catalyst

    September 2, 2026
  • youtube
  • x
  • Privacy Policy
  • Disclaimer
  • Terms & Conditions
  • Support Center
  • Media
  • Contact Us

©2026 TenTen Capital LLC DBA SpotGamma

All SpotGamma materials, information, and presentations are for educational purposes only and should not be considered specific investment advice nor recommendations. Futures, foreign currency and options trading contains substantial risk and is not for every investor. An investor could potentially lose all or more than the initial investment. Risk capital is money that can be lost without jeopardizing one's financial security or lifestyle. Only risk capital should be used for trading and only those with sufficient risk capital should consider trading. Past performance is not necessarily indicative of future results. Testimonials appearing on this website may not be representative of other clients or customers and is not a guarantee of future performance or success.

View Full Risk Disclosure