Macro Theme:
Major Resistance: $4,260 (SPY $425 Call Wall)
Pivot Level: $4,200
Interim Support: $4,200
Range High: $4,300 Call Wall
Range Low: $4,000 Put Wall
‣ QQQ Call Walls ($350) continue to roll higher, implying better relative upside performance
Founder’s Note:
S&P Futures are higher to 4,235 (+0.50%), with NQ +1.16% after the holiday weekend. SPX & QQQ
Call Walls hold their places at 4,300 & 350, respectively, while the SPY Call Wall has rolled to 425. The implication here is that QQQ is overbought, while the S&P has a bit more upside before hitting that condition. With that, we mark resistance for today at 4,252 with support at 4,200 in the S&P. The QQQ’s have no material resistance lines above 350, and so we look for mean reversion in the Nasdaq.
TLDR: tech is overbought, and dependent on more 0DTE chasing to counteract very elevated IV’s.
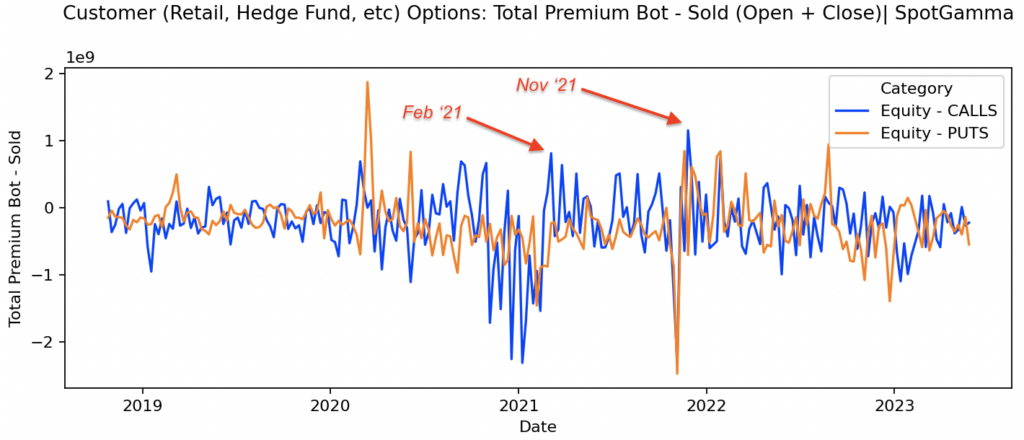
Below is data from the OCC, which tallies weekly options buying & selling. In blue is the total net premium of equity calls bought (to open, and close) vs sold (to open & close). What you see is that equity call premiums were flat, with puts negative. This informs us that the number of traders going long equity calls are being offset by traders selling calls, particularly exiting long calls (vs closing shorts).
Further, this current call activity appears to be “day trading”, and not (yet) of the massive size seen in previous manias. This may be because the attack vector has been limited to a handful of AI names. Second, there could be more demand for the underlying (vs calls) based on long term macro narratives/regrossing. The takeaway here is that we certainly see calls selectively involved in the squeeze, but it again reads more as an AI-contained mania.
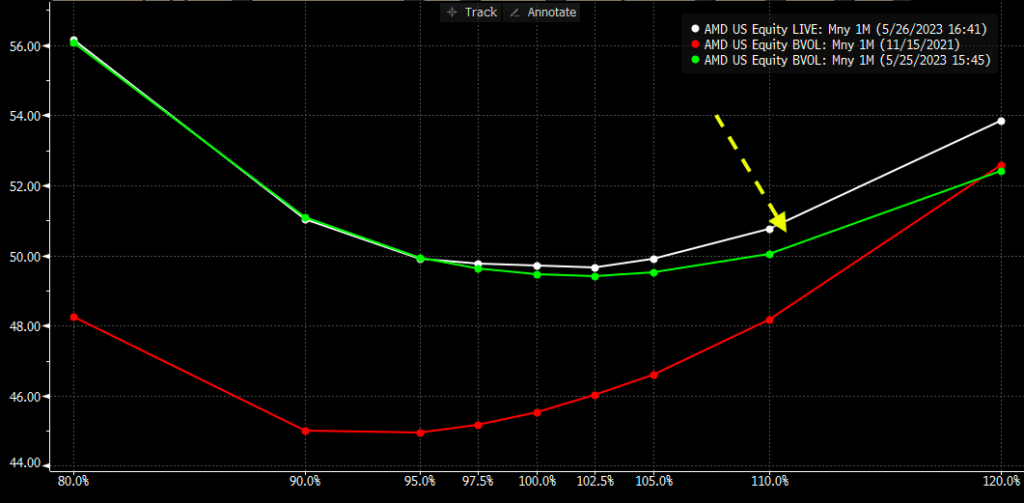
On Friday AM we had commented that “there may currently be more crazy upside left in the tank”, with this image of AMD call skew. Friday’s 5-10% rally in the AI names led to call skew picking up on Friday, as you can see below with Friday’s AM skew in green (5/25) vs white (today). AMD is now up 50% in May, and the issue here is that as upside call IV’s get higher it requires incrementally higher underlying volatility to justify those elevated call IV’s. This ultimately incentivizes call sellers to come in, which could reverse hedging flows and cool off rallies.
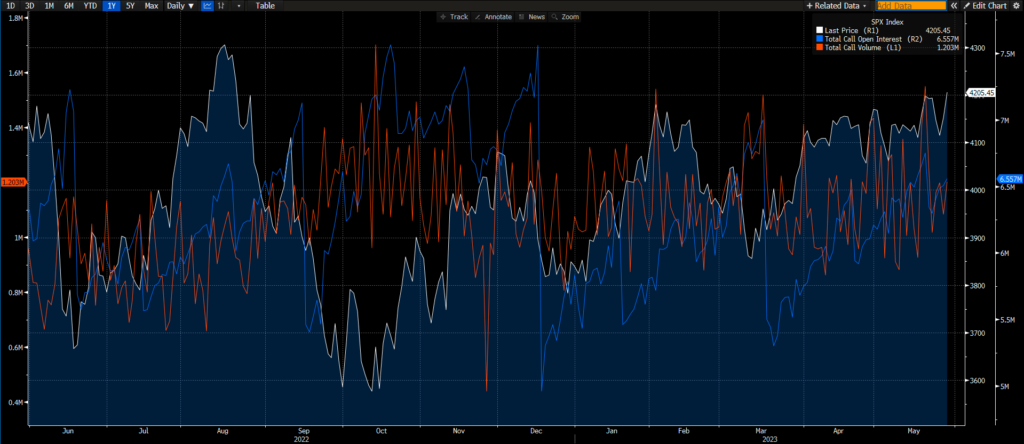
The question here is will the AI basket cool off in favor of a more broad based rally – particularly if the debt ceiling is resolved? Shown below is SPX
call volume (red) & call open interest (blue). As you can see both are well off recent highs, backing the idea that there hasn’t been broad call buying. Renewed call activity in this space could certainly help sustain the rally, and to this point we see bulls in control while the S&P holds 4,200.
Additionally, we now favor expressing longs via S&P500 vs tech, as tech is overextended based on our call data.
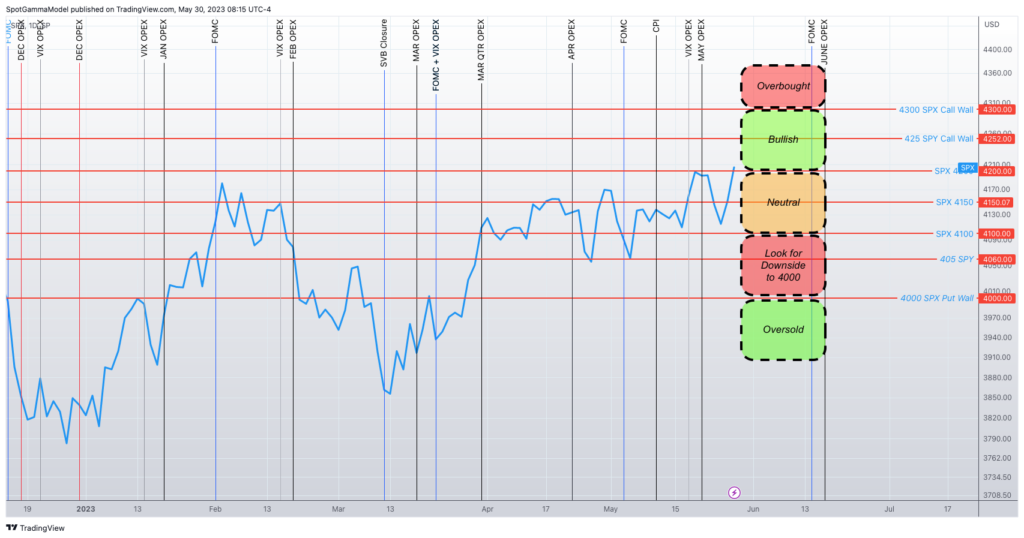
To the downside we would read a break of 4,200 as “consolidation”, and see likely support in the 4,150 area. Full “risk off” is not likely unless 4,100 gives way, with 4,000 still seen as major long term support.
| SpotGamma Proprietary Levels | SPX | SPY | NDX | QQQ | RUT | IWM |
|---|---|---|---|---|---|---|
| Reference Price: | $4205 | $420 | $14298 | $348 | $1773 | $176 |
| SpotGamma Implied 1-Day Move: | 0.85% | 0.85% | ||||
| SpotGamma Implied 5-Day Move: | 2.34% | |||||
| SpotGamma Volatility Trigger™: | $4185 | $419 | $13175 | $339 | $1770 | $175 |
| Absolute Gamma Strike: | $4150 | $420 | $13850 | $350 | $1800 | $175 |
| SpotGamma Call Wall: | $4300 | $425 | $13850 | $350 | $1790 | $180 |
| SpotGamma Put Wall: | $4000 | $415 | $12500 | $332 | $1700 | $170 |
| Additional Key Levels | SPX | SPY | NDX | QQQ | RUT | IWM |
|---|---|---|---|---|---|---|
| Zero Gamma Level: | $4149 | $422 | $0 | $348 | $1878 | $182 |
| Gamma Tilt: | 1.381 | 0.826 | 2.809 | 1.006 | 0.728 | 0.627 |
| SpotGamma Gamma Index™: | 1.685 | -0.164 | 0.090 | 0.002 | -0.022 | -0.065 |
| Gamma Notional (MM): | $602.915M | ‑$693.57M | $13.21M | $47.224M | ‑$22.536M | ‑$672.022M |
| 25 Day Risk Reversal: | -0.068 | -0.07 | -0.043 | -0.044 | -0.061 | -0.067 |
| Call Volume: | 537.993K | 1.821M | 12.862K | 1.058M | 13.196K | 242.798K |
| Put Volume: | 1.003M | 3.058M | 11.756K | 1.844M | 23.534K | 457.634K |
| Call Open Interest: | 6.405M | 6.737M | 69.813K | 4.539M | 204.264K | 3.475M |
| Put Open Interest: | 12.298M | 13.853M | 61.05K | 9.334M | 358.388K | 7.406M |
| Key Support & Resistance Strikes |
|---|
| SPX Levels: [4200, 4150, 4100, 4000] |
| SPY Levels: [420, 418, 415, 410] |
| NDX Levels: [15125, 15100, 14000, 13850] |
| QQQ Levels: [350, 345, 340, 330] |
| SPX Combos: [(4399,98.26), (4374,76.86), (4348,96.17), (4323,93.69), (4319,94.42), (4311,74.47), (4306,82.87), (4298,99.62), (4290,83.01), (4285,79.43), (4281,89.16), (4277,96.96), (4269,83.69), (4264,87.01), (4260,89.57), (4256,90.59), (4252,99.21), (4243,95.53), (4239,96.89), (4235,89.77), (4231,89.22), (4226,98.11), (4218,89.74), (4214,83.49), (4210,92.68), (4205,88.81), (4201,98.59), (4189,91.87), (4184,93.81), (4180,82.74), (4155,86.36), (4126,80.05), (4100,81.67), (4054,77.22), (4050,90.57), (4025,76.48), (4004,86.05), (3999,95.96)] |
| SPY Combos: [429.24, 424.62, 419.58, 439.32] |
| NDX Combos: [13855, 14370, 13626, 14770] |
| QQQ Combos: [337.61, 350.15, 332.03, 359.91] |
SPXSPYNDXQQQRUTIWM
SPX Gamma Model
May 29$3,386$3,836$4,286$5,047Strike-$1.6B-$825M-$75M$1.3BGamma NotionalPut Wall: 4000Call Wall: 4300Abs Gamma: 4150Vol Trigger: 4185Last Price: 4205
©2023 TenTen Capital LLC DBA SpotGamma
All TenTen Capital LLC DBA SpotGamma materials, information, and presentations are for educational purposes only and should not be considered specific investment advice nor recommendations. Futures, foreign currency and options trading contains substantial risk and is not for every investor. An investor could potentially lose all or more than the initial investment. Risk capital is money that can be lost without jeopardizing one’s financial security or lifestyle. Only risk capital should be used for trading and only those with sufficient risk capital should consider trading. Past performance is not necessarily indicative of future results. VIEW FULL RISK DISCLOSURE https://spotgamma.com/model-faq/disclaimer/