Frequently asked questions about HIRO
As a member of the elite SpotGamma Alpha subscription, users have access to the full suite of SpotGamma products, including the real time HIRO Indicator.
HIRO is a powerful tool that we’re confident can become an integral part of every trading strategy. To get familiar with the features included in this product, below we’ve listed answers to the most frequently asked questions about the HIRO Indicator.
1. What is the SpotGamma HIRO Indicator?
The HIRO Indicator is based on a proprietary SpotGamma algorithm and captures the “impact” of all options trades in real-time. At the core of the signal, HIRO estimates the associated hedging impact for options dealers & market makers.
2. How can I use the SpotGamma HIRO to help me trade?
There are two unique insights that HIRO provides. The first is the impact over a time period during the live trading day when large options hedging flows may have a cumulative impact on the volatility and direction of a stock or index’s movement. Secondly, there are acute trades which take place that will need to be hedged, and by tracking this activity there may be opportunities to adjust positions.
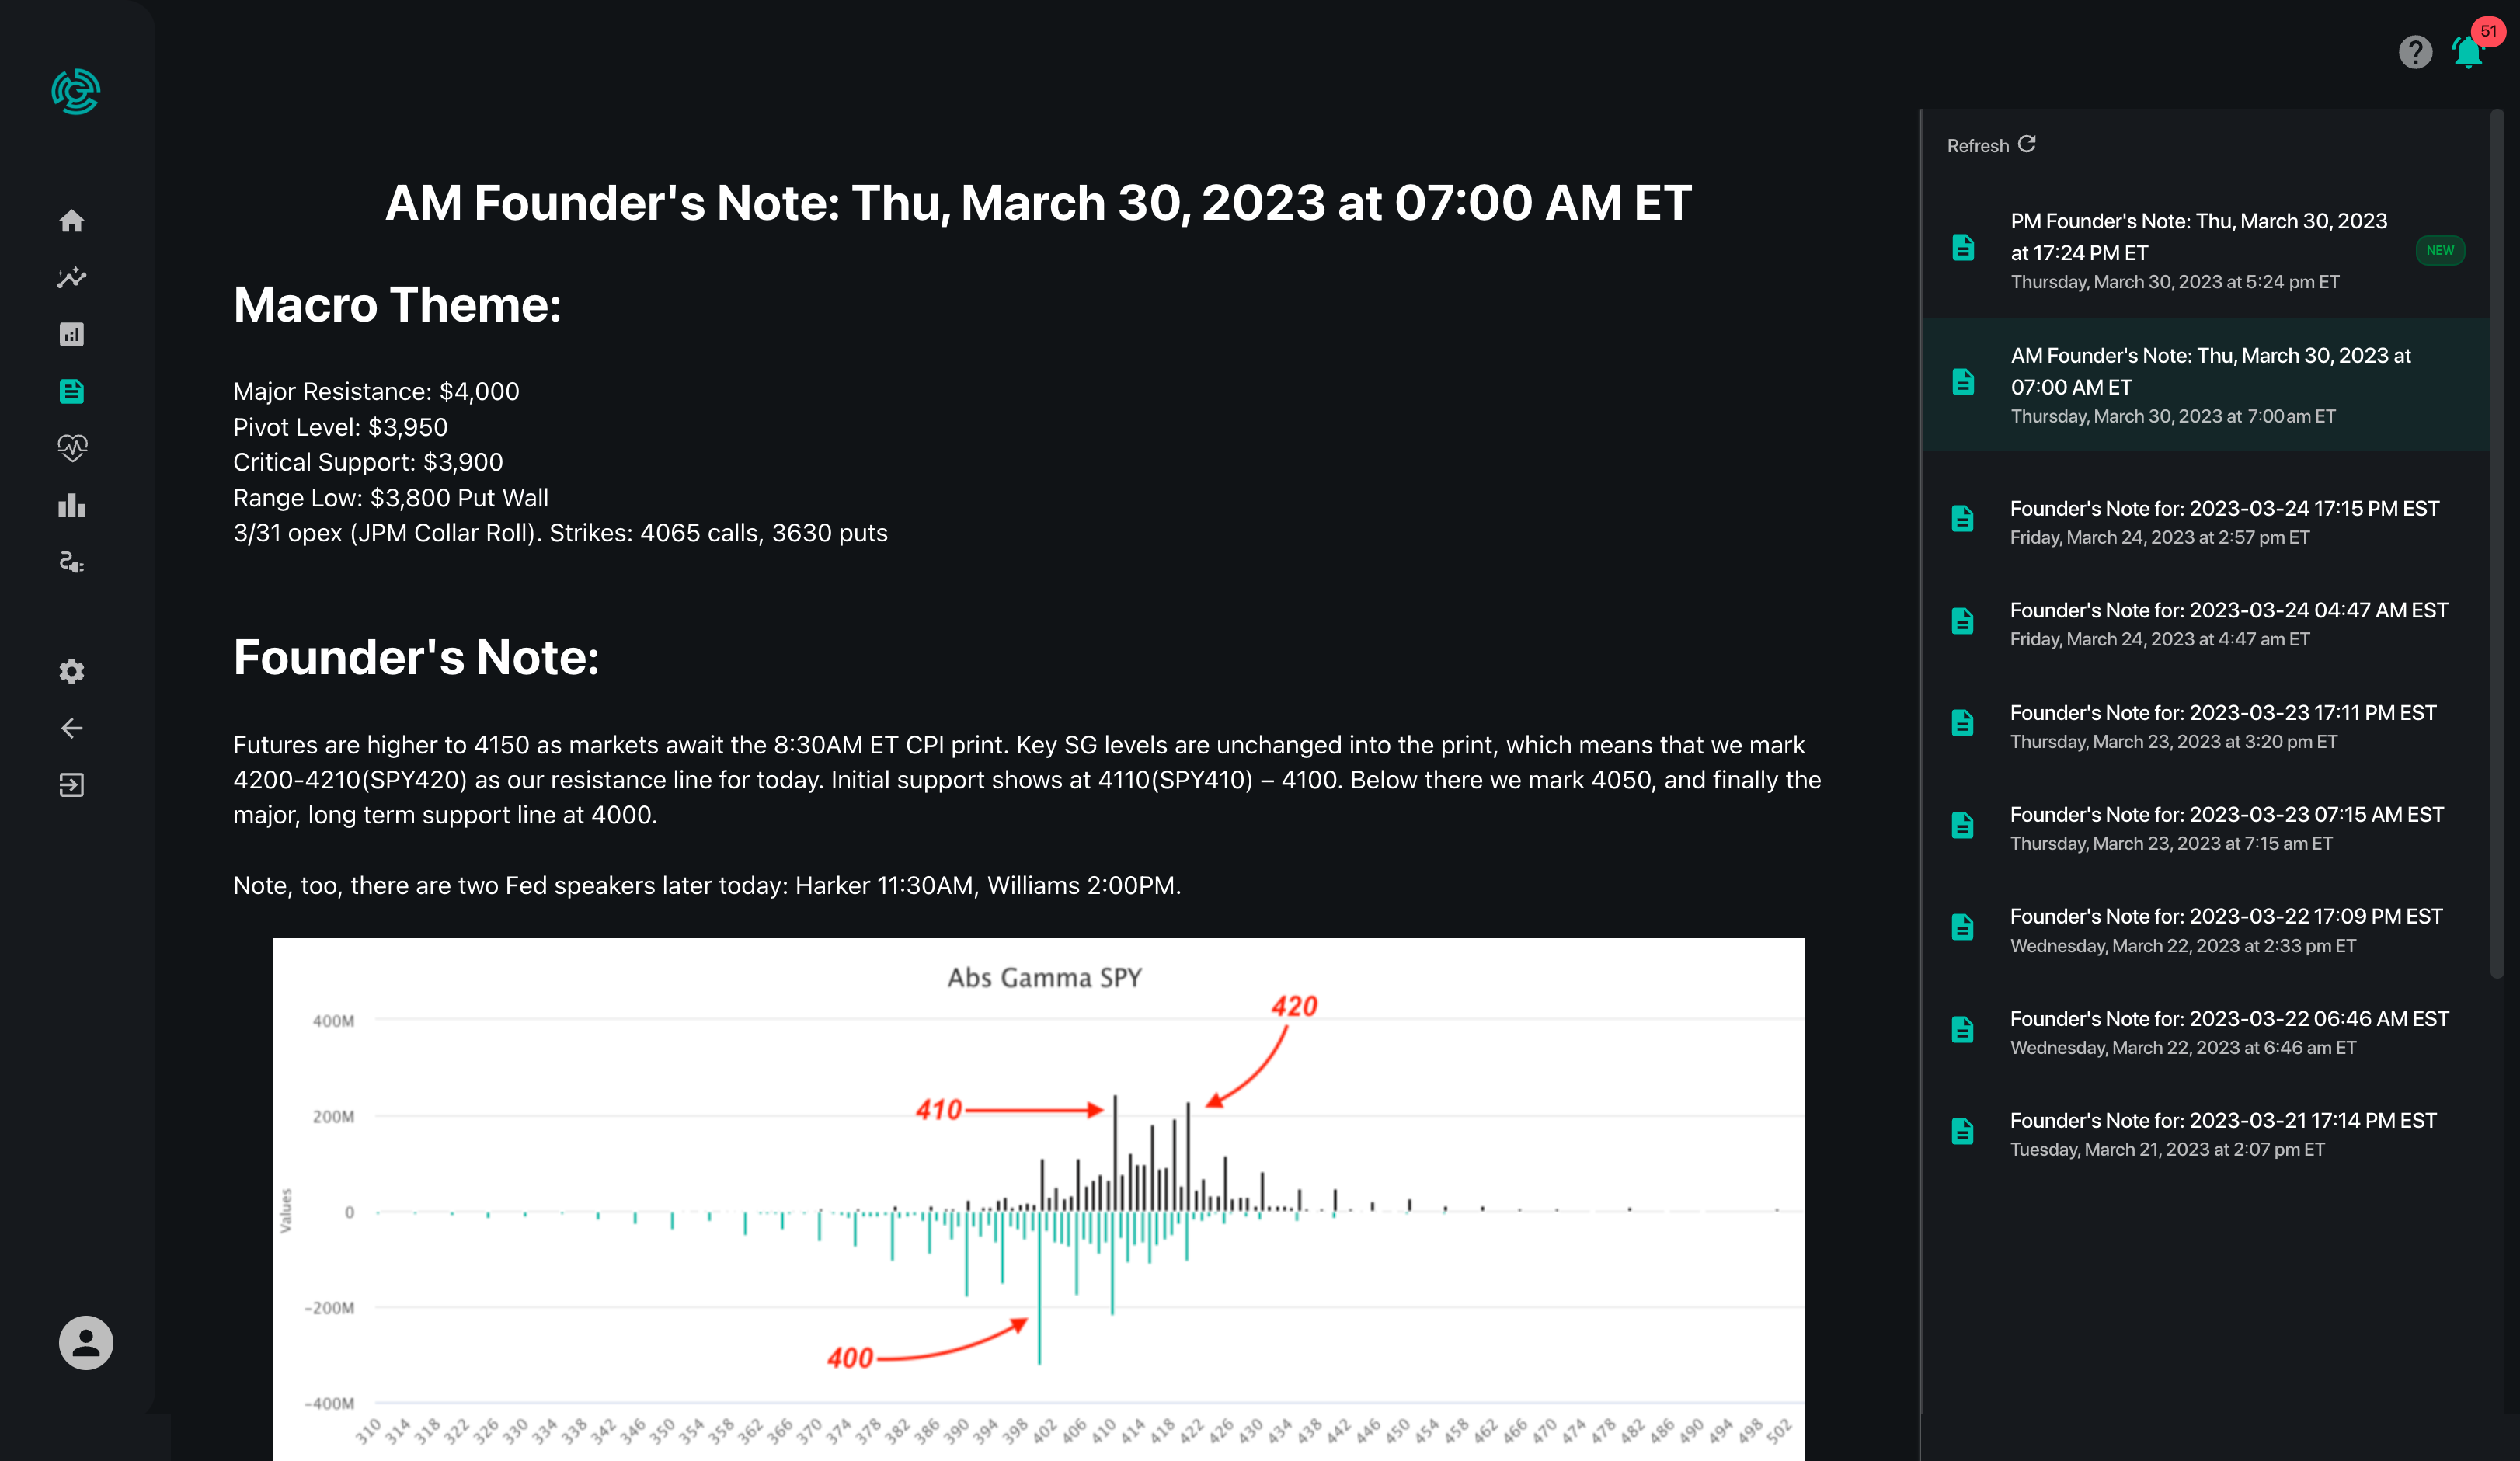
3. What are the trending stocks listed?
These are stocks of material interest, as determined by a proprietary algorithm SpotGamma. Specifically, this list highlights companies with unusual activity which warrants attention.
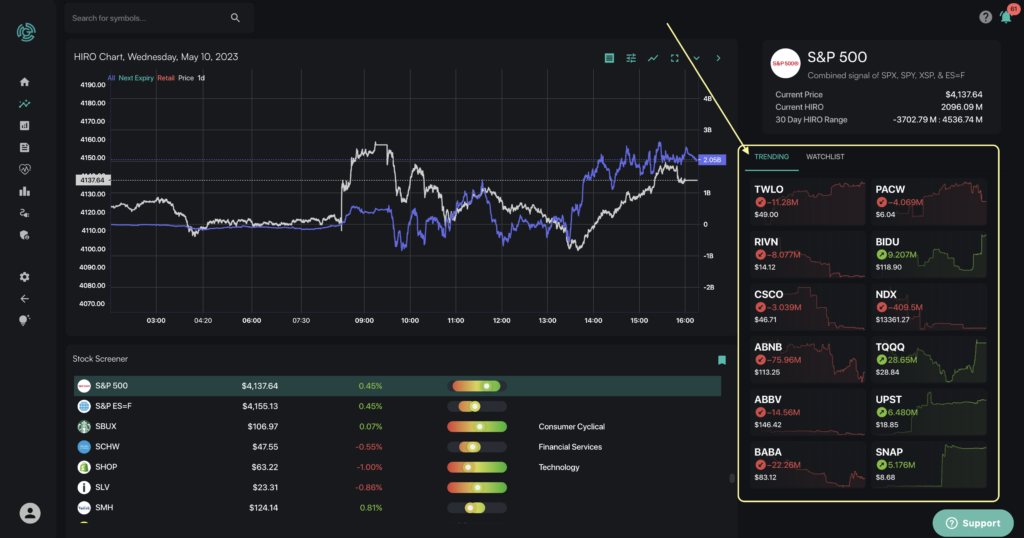
4. What does the sliding scale in the “HIRO Signal” column indicate?
- Range of the entire bar: The width of the full indicator represents the 30-day range of the HIRO signal on a stock or index (Hedging Impact of Real-time Options). Here, this is represented by the full width of the long gray shape.
- Solid colored segment: The width of this section represents the 5-day range of the HIRO signal on a stock or index. Here, it is represented by a green area.
- Open Circle: This shows today’s HIRO signal relative to the last 30 days & last 5 days. The color of the circle itself relays what the intraday flow is (green positive HIRO signals and red for negative HIRO readings). For instance a dark red circle indicates the HIRO signal is near the low of the day.
- Colors:
- Red: indicates negative delta flow (traders sell calls and buy puts)
- Green indicates positive delta flow (traders buy calls and sell puts)
- Yellow indicates a neutral position
5. What does the number beside the sliding scale in the “HIRO Signal” column indicate?
That is the numerical value of the HIRO indicator. This is proprietary signal similar to that of delta notional. This signal is standardized across underlyings so that you can compare the HIRO value across instruments.
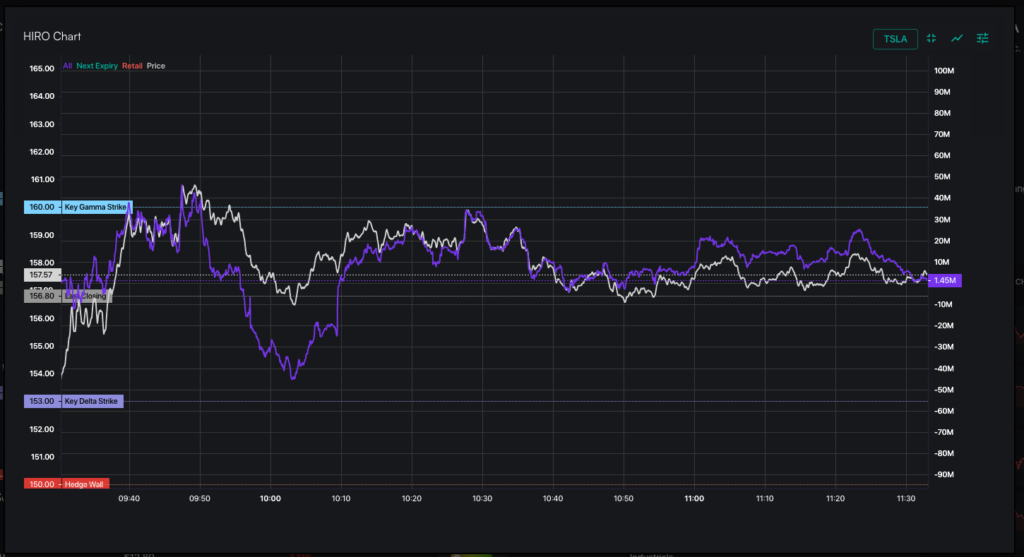
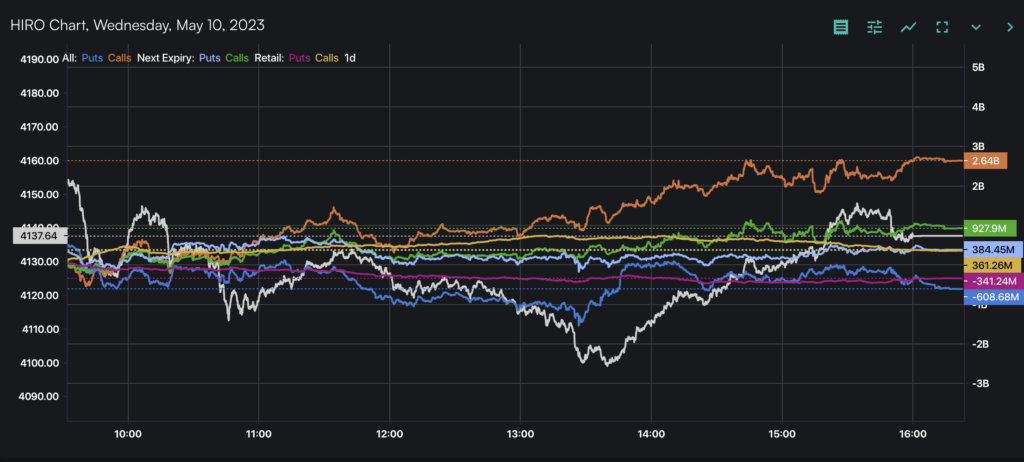
6. What does each line on the Stock Price Chart represent?
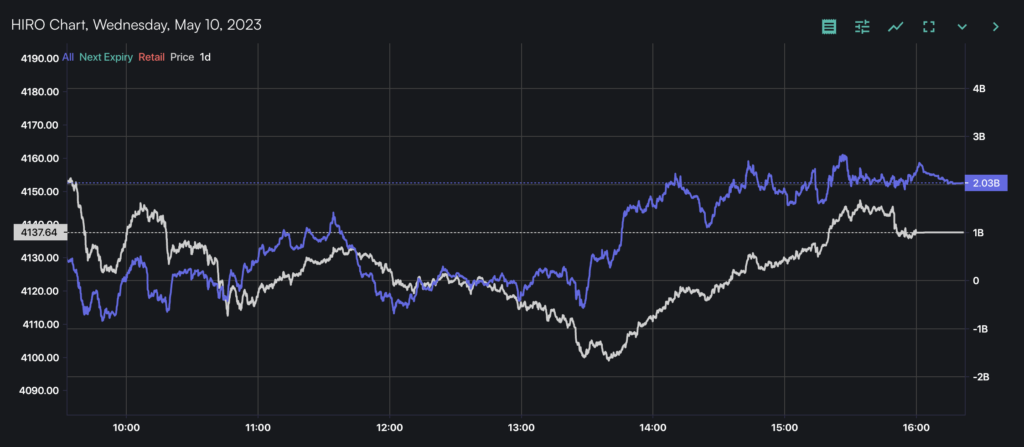
White Line (Price): This white line reflects the current price of the stock or index. This updates in real time.
Purple Line (Total Aggregate HIRO Reading): This purple line reflects the total hedging pressure. If the purple line is upward sloping (positive), then it reflects the impact of traders buying calls and selling puts. If the purple line is downward sloping (negative), then it reflects the impact of traders are selling calls and/or buying puts.
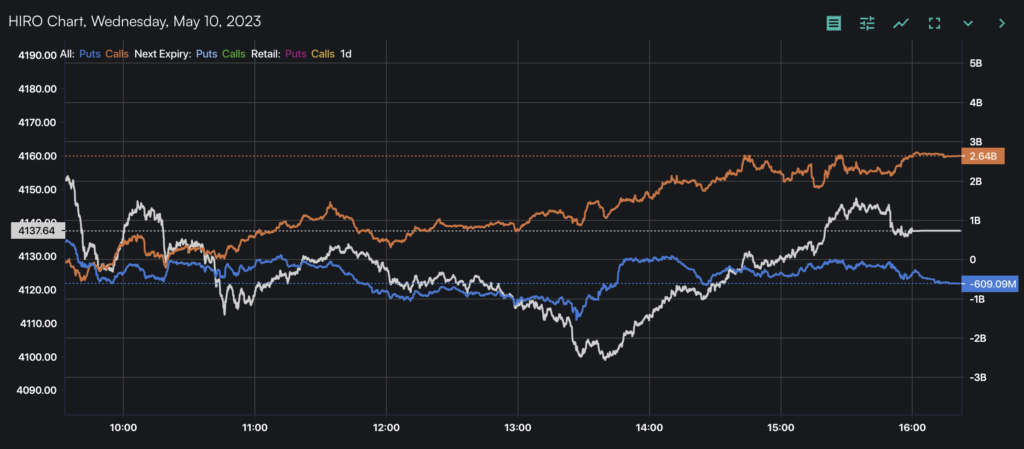
Blue Line (Puts Only) – The HIRO reading for put options only. If it is positive, that reflects the impact of traders selling puts. If it is negative, that reflects the impact of traders buying puts.
Orange Line (Calls Only) – The cumulative HIRO reading for call options only. If it is positive, that reflects the impact of traders buying calls. If it is negative, it reflects the impact of dealers selling calls.
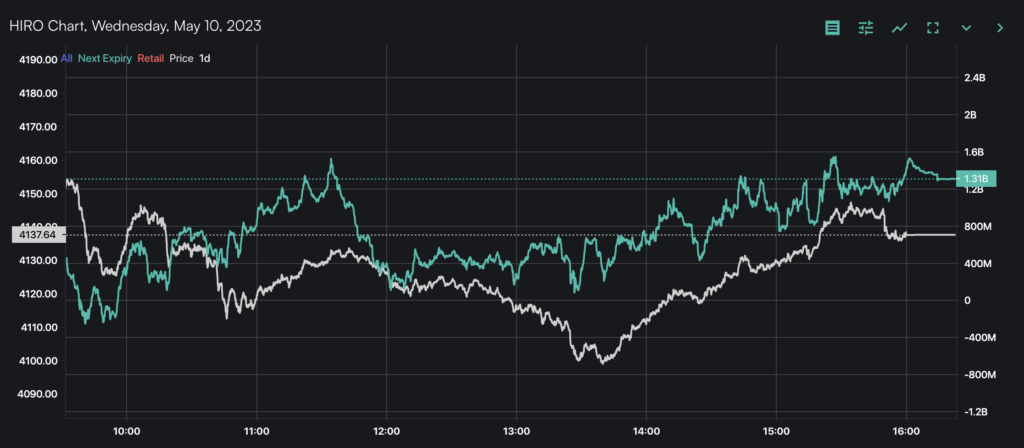
Green Line (Next Expiry Only) – The Next Expiry filter, or 0DTE filter, highlights the activity across stocks relative to only the next available expiration. This means that we are showing you the options flow that is tied to the next available exploration for that instrument. For SPX, SPY, and QQQ, this is typically done in the same trading day. For large stocks like Apple and Tesla, the next expiry filter will generally highlight the flow that is tied to the next Friday expiration.
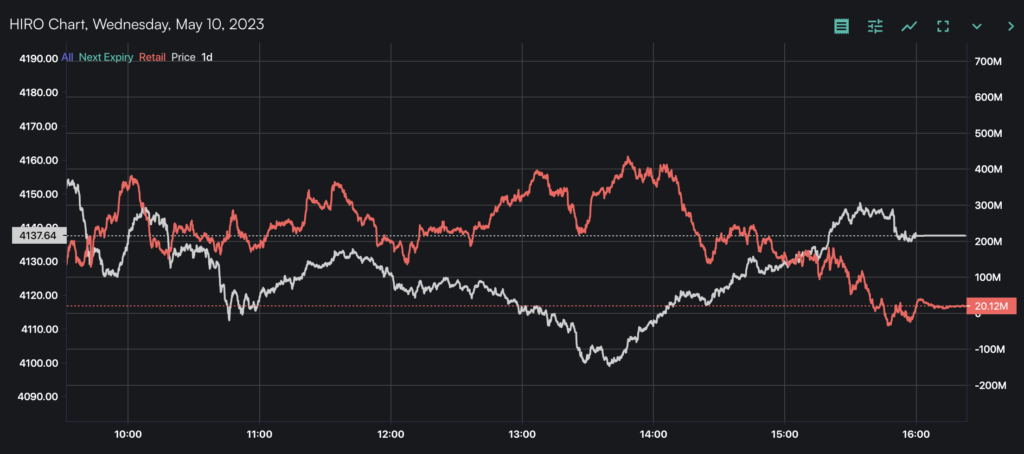
Red Line (Retail Only) – The Retail Filter allows you to see the retail-only Delta hedging pressure based on non-institutional trades. SpotGamma uses some proprietary logic to identify and reveal which trades are likely retail-driven.
When viewing the HIRO chart for a single stock, ETF or index, you can toggle on and off all available filters on both the Total and Put/Call chart.
For additional questions and helpful articles about the HIRO Indicator, feel free to check out the SpotGamma Support Center for more information.
