In the presentation and outline posted below, SpotGamma presents a view that equity markets are experiencing dramatically low levels of volatility. The generally low levels of volatility are likely in response to both monetary & fiscal policy, globally, as low volatility is seen across many assets and regions.
However, we believe that the impact of both 0DTE options and call overwriting ETF’s results in removing equity tail moves – that is that stock index movement both up & down does not deviate. As a result, price distribution is uniform in way’s not seen since 2017.
Further, these products may be driving index correlation down to lows never seen before. These two factors, low volatility, and low correlation, are a signal of lurking market risk.
The US equity market has been experiencing an unprecedented period of market calm. Many analysts point to derivative products like 0DTE options, and systematic call overwriting ETF’s as the culprit, suggesting that these flows are artificially suppressing stock volatility and the VIX.
The CBOE and others have pushed back against this idea, saying that volatility is simply low across all assets, and there is nothing anomalous occurring.
Our research concludes that there is indeed very low volatility across assets, likely a function of central bank policies. However, inside of this general lack of volatility lies an equity tail suppression that is anomalous.
This, we believe, is a function of the rapid increase of derivative products like zero DTE & call overwriting ETF’s. Further, these products may be driving record low levels of correlation, as index volatility is suppressed while single stock volatility is moving higher.
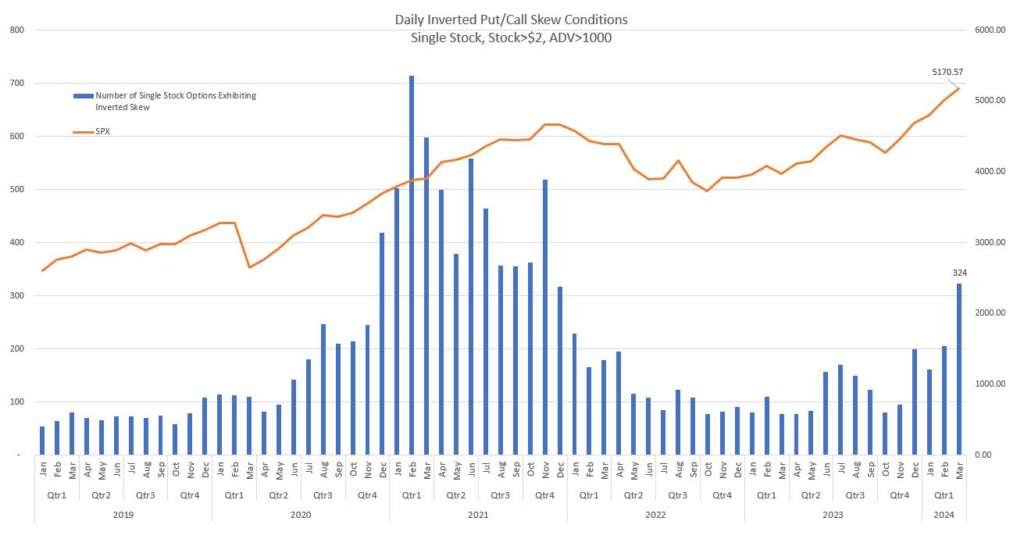
“Stock up, vol up” can be seen in an increasing number of stocks which have an “inverted put skew”. In the CBOE-produced chart below call IV’s are higher relative to put IV’s at an increasing. This is often a signal of high demand for call options, as investors look to gain exposure to upside movement in single stocks.

Equity Volatility is at Record Lows
First, looking at basic equity volatility, you can see that we are currently experiencing the 3rd longest streak of SPX sessions without a <-2% decline. Additionally, on the right, you can see that we recently closed the 4th longest streak without a >2% increase in the equity market. Note that on 2/22 the SPX jumped +2% on NVDA earnings, but has not returned >2% since.

It strikes us as very unusual that we are simultaneously experiencing both a lack of large declines and large increases in the S&P500.
The only similar period was 2017 into 2018, wherein the S&P500 saw its lowest level of 1-month SPX realized volatility ever, at ~3.5% in October. That record period of calm, the second highest ever, gave way to Volmegeddon in February of 2018. Of course the 2017 period, and Volmegeddon, was made famous by the billions in reverse VIX ETN trading that unwound violently in February 2018.
There are other periods of record calm that snapped spectacularly, including:
- (1)The GFC kicked, which kicked off in June of 2017
- (7)Prospects of a trade war, and interest hikes led to a ~15% decline in Q4 of ’18
- (8)The Covid Crash of March ’20
The current unprecedented calm is unsurprisingly reflected in the VIX, which reflects the prices of 30 day SPX options, and the VIX9D which measures 9 day SPX options.
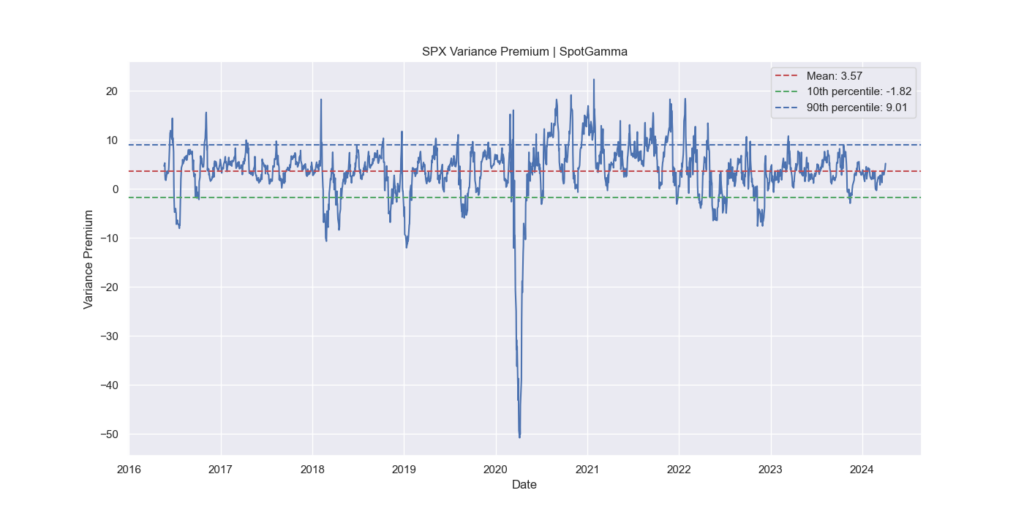
At a high level we can estimate that the VIX is “fairly valued” based on the historic movement, or realized volatility of the S&P500. This is seen via the current spread between 1-month SPX realized volatility, and the VIX, plotted below.

The +10 year mean is shown via the dashed red line, which indicates that the average spread between 1-month RV & the VIX is ~3.5pts, which is roughly this models current reading.
However, when we look under the volatility hood, we can see that the VIX is exhibiting an incredible level of calm. Yes, the average reading has is currently near fair value, but the stretch of time in which is it has stuck to fair value is the longest in over 10 years. This can be seen by the plot on the right, which measures the number of days without a +2STD DEV move in the VIX.

Many blame 0DTE options with removing demand for VIX & volatility products. The chart on the left measures the VIX9D, which is calculated using S&P500 Index options with an average expiration of 9 days, vs 30 days for the standard VIX.
What you can see is that this shorter-term measure of volatility is also exhibiting a record stretch of calm. We would note this extended period of calm covers the March ’23 bank crisis, in which the Fed was forced to contend with the collapse of Silicon Valley Bank, amongst others.
Pivoting, we can indeed see that this calm is extended across asset classes, as shown in this chart from the CBOE, which measures rate vol, credit, oil, gold and FX. We would also note relative calm is also seen in foreign equities, particularly those in Europe.

While index volatility is calm, we have seen rapid, volatile moves in select single stocks, for example, the semiconductors. This has created a shift higher in dispersion readings, as shown below, in blue. These dispersion readings signal that many stocks inside of the indexes are exhibiting larger moves relative to other index cohorts.
For example, SMH, the semi-ETF is up ~30% YTD, while XLP, the consumer staples ETF, is up a mere ~4%. One could look at high dispersion in a similar vane to poor market breadth.
While dispersion increased, equity volatility (yellow) has been fairly low. Further, correlation (red) is at multi-year lows. Correlation at lows informs us that not all index constituents are moving higher.
Compare this to times of crisis, like in March ’20, wherein all stocks crashed. This resulted in correlation spiking towards 1, and volatility increasing substantially. Further, dispersion readings move higher because some stocks fell faster relative to others. For example, in March ’20 cruise lines, oil, hotels, etc all dropped much farther an faster relative to, say, pharmaceutical shares.

S&P Global discusses why these readings may matter in an analysis of similar readings from the 2000 internet bubble. During that period there was low equity volatility, but a jump in dispersion as traders piled into internet stocks like “pets.com”.
The S&P suggests that periods of high dispersion and low volatility may “…better capture periods where only a portion of the market either bubbles or crashes.” (for additional color on these dynamics, find our note here).

Are 0DTE & Derivative ETF’s Causing Low Volatility?
Derivative ETF’s have surged in assets over the last several years to +$100bn, driven primarily by call overwriting ETF’s. These ETF’s seem to attract investors based on their high dividend yields.
The effect of these positions is to place the options dealer community into a large positive gamma position. Positive gamma hedging may result in suppressed index equity volatility as options dealers sell heavy amounts of shares into S&P500 rallies, and buy large amount of shares into S&P500 declines.
There is indeed a correlation between high levels of positive gamma, and low equity volatility. This can be seen in the chart below from SpotGamma. On the X axis is our daily index gamma reading, with the most positive readings on the right of the chart. As gamma shifts into more negative readings (left on the chart), forward 1 day SPX volatility (Y axis) increases.
In this plot we have marked the last year in orange, and you can see the readings with positive market gamma exhibit similar behavior to previous years. However, when you move to a negative gamma space you may note that the volatility is substantially less than in prior years.
This can be seen with very few readings in the prior year having daily moves ±2% (red boxes). In other words, there are no tail returns.

We believe that the removal of tails is due to the increase in 0DTE options trading. 0DTE SPX options volume is now near 50% of total SPX volume, after daily expirations were fully listed in November of ’22. Additionally there are 0DTE listings in the SPY, QQQ, IWM & RUT.
SpotGamma’s analysis of 0DTE options flow suggest it leads to mean reversion in the S&P, which in turn reduces tail moves.
An excerpt from this study is below, where measures signed volume of options market makers in SPX 0DTE options over several months. What you can see is that market makers tend to be short (blue) slightly out-of-the-money puts, and long (red) further out-of-the-money puts.
This is essentially an iron fly, or condor position, which profits when the SPX index exhibits relatively small moves.
Calls, shown here, show market makers with a similar “butterfly” profile.
Given the very low volatility of the S&P500 complex, one can surmise that this type of 0DTE position is likely profitable for the market maker community. We’d also opine that market makers would continuously adjust models to eliminate any type of negative edge in 0DTE flows.
While correlation is not causation, its clear that many shifts in volatility & correlation started in late ’22, which is when 0DTE’s became listed each day of the week. However, this period also marked the bottom of the stock market after the 2022 decline, and a slowing of interest rate hikes.

In their study of derivative-linked ETF flows, JPM posits that option-based ETF’s, and their gamma supply, are drivers of the lower VIX. However, they fail to flag the launch of 0DTE trading, and its associated increase in SPX index option volume.
You can see the 0DTE launch in our annotation of their gamma/VIX chart, below. There is clearly a marked correlation between the declining VIX, increase in gamma, but also the onset of 0DTE.

For a more in depth review of all of the various elements discussed in the outline above, please see our 40 minute presentation, here.
You can download the associated slide deck, here.
