Dispersion readings are hitting highs per @SPGlobal, particularly in Mid Caps, while correlation is moving toward lows and volatility is flat.
What does that mean? Why does it matter?
High dispersion means individual components of an index are moving more than the whole, similar to the idea of market breadth. Traders have complained that the current market has “lacked breadth”. Low correlation tells us not all components are moving in the same direction.
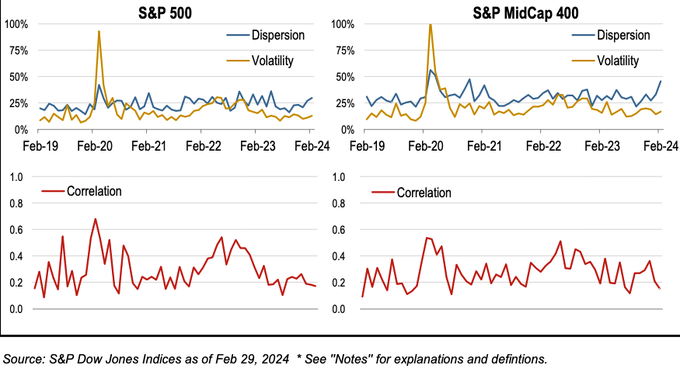
Dispersion is measured by calculating the weighted average of the variances (i.e. movement) of individual stock returns relative to a stocks weighting in the index. This therefore reflects the performance of the individual stocks in the index vs the index’s overall performance. ex: “MSFT is +5% while vs SPX +1%, and MSFT is 7% weighting in the SPX” (it really is a 7% weighting).
This is where correlation comes in (chart above, red line plots). As noted, correlation is at lows (SP500 left, SP400 right in the chart above).
Correlation measures the degree to which stocks move in relation to each other, indicating how closely their returns are linked over a given period. Currently we see low correlation with high dispersion, which indicates that stocks are moving significantly but in different directions, highlighting a lack of a unified market trend and suggesting diverse individual stock performances independent of the overall market movement.
This also hearkens back to “lack of breadth” as a risk flag in this rally. ex: “Semi’s and crypto are crushing it, everything else is a drag.”
Conversely, when correlation is high with a high dispersion reading , it suggests that while individual stocks are moving significantly, they tend to move in the same direction as the overall market, indicating a broadly uniform market trend but with varying degrees of intensity.
The prime example of this this was the March Covid crash, where everything was going down, but some stuff crashed more than others. Lastly, note that SPGlobal includes a plot of index volatility (yellow) against dispersion (blue).
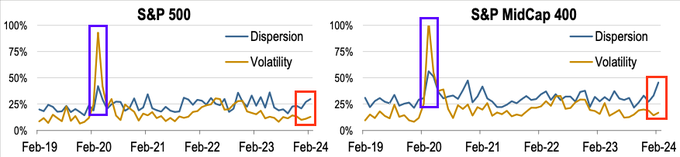
As you can see, dispersion is increasing with volatility stagnant (red box). Compare this to the Covid crash wherein vol went up with dispersion (blue box). This current reading is symptomatic of the “stock up, vol up” environment we’re in, wherein there is thematic chasing (i.e. semis gone wild), but other stuff is left more or less drifting.
What’s the significance of dispersion – volatility spread?
The argument is that one would normally view an increase in dispersion to current levels as a signal of volatility (i.e. more movement) more normally associated crashing markets. But the fact that index volatility is not going up is indicative of….bubbles?
SP Global highlights the period of 1999-2001 as showing: “a marked dispersion, driven by the deeply idiosyncratic behavior of the technology sector. But index volatility did not rise, as sectors other than technology performed more normally. Thus, dispersion can better capture periods were only a portion of the market either bubbles or crashes.”
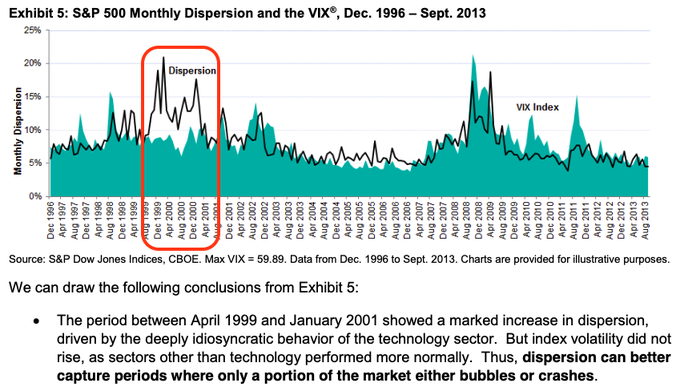
That sounds pretty familiar, regardless of if you think current trading action is more warranted (i.e. the AI revolution is not the internet bubble). These trends can last for some time, as they did in 2001. The dispersion – vol spread started in late 1999 and didn’t close until early ’21. This was after the bubble popped in Q3 of ’20. So, what are some quicker signal that the party is over? For that you want to watch for signals that the “stock up, vol up” regime is stalling out, which should coincide with a reduction in call volumes. One way to catch this shifting behavior is through looking at skew. Consider the 1 month SMH (semi ETF) skew (green), which shows upside calls all with a higher IV than at-the-money IV. This is a signal of high demand. Conversely, put IV is depressed.
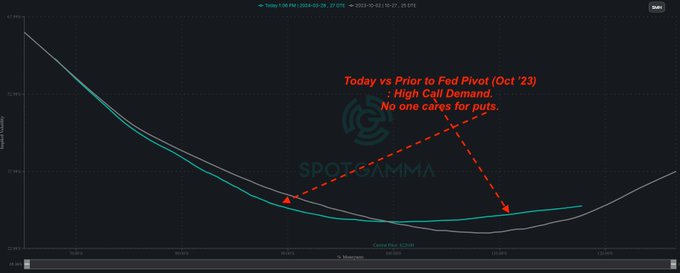
If & when the SMH upside demand stalls, we’d expect skew to shift back towards something like Oct ’23 (gray line), which results in call IV deflating, and put IV increasing.