• Skip to main content
  • Skip to primary sidebar

SpotGamma™

S&P 500 Stock Market Gamma Trading Levels Based on Options Open Interest

  • About
  • Pricing
  • Academy
  • Resources
    • Tool Demos
    • Case Studies
    • Blog
    • Support Center
    • Free Daily Report
    • Free Trading Tools
      • Options Profit Calculator
      • SPX Gamma Exposure
      • Implied Earnings Moves
      • Volatility Ranking
    • Free Training
    • Report Card
  • Login

Apr 19 2021

JPMorgan: Clients Are “Increasingly Nervous”, Fear “A Market Pullback In May Or June”

BY TYLER DURDEN SUNDAY, APR 18, 2021 – 08:49 PM

Much to the delight of bulls everywhere, the past month has been a relentless meltup in stocks, commodities, cryptos, and – paradoxically over the past week when we have been bombarded with stellar economic data – Treasurys as well.

After dumping at the end of March to a low of 3,843, spoos have seen an almost flat-line diagonal move higher over the past three weeks, hitting an all time high of 4,183 on Friday (trading a little softer over the weekend following the crypto rout) following one blockbuster economic data point after another, and a solid start to earnings season to boot.
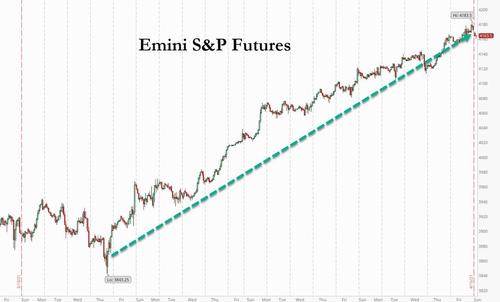
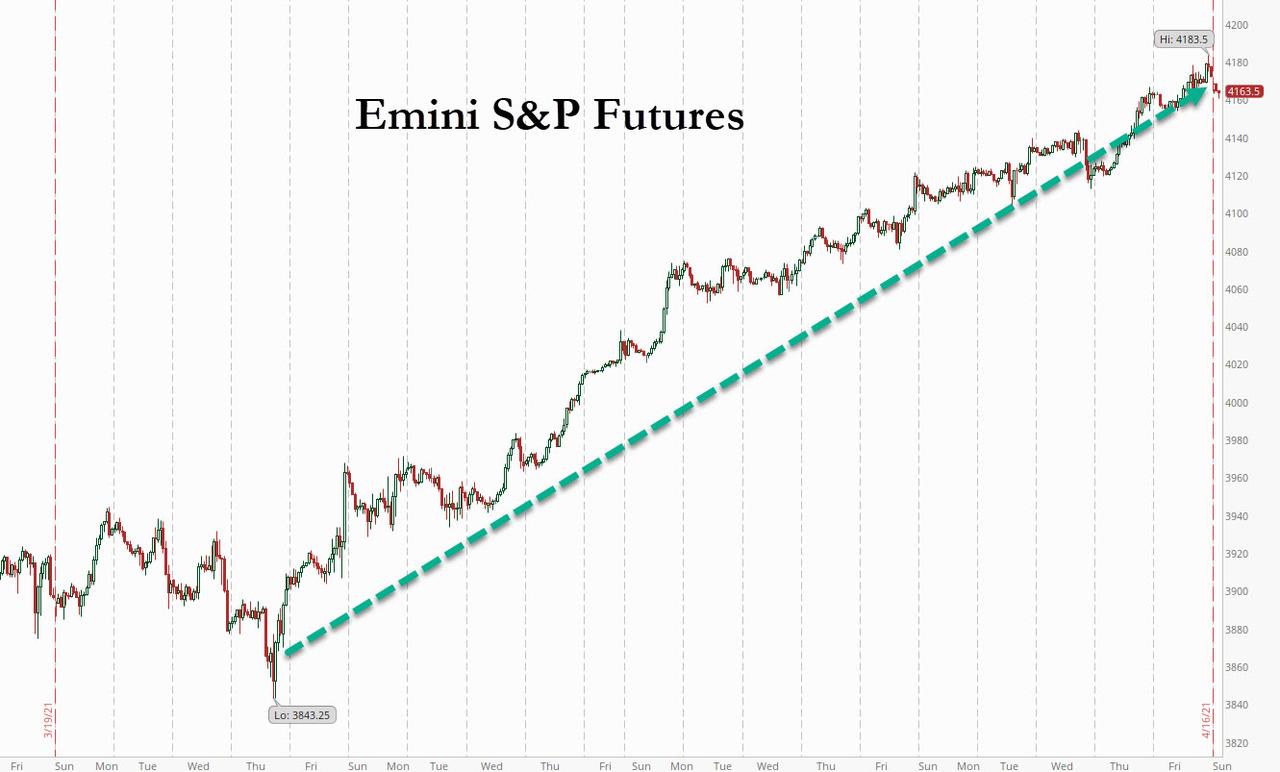
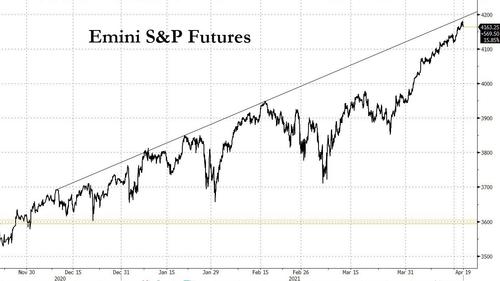
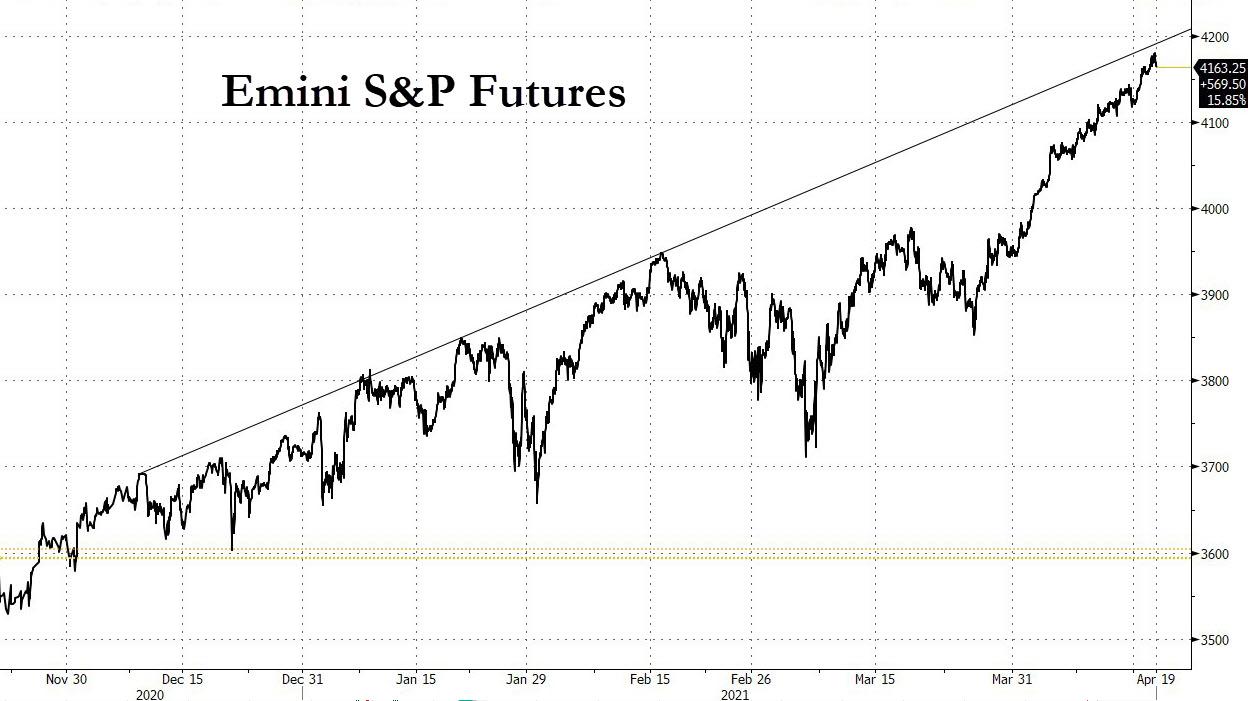
If one looks purely at technicals (i.e., lines drawn on a chart which somehow predict stuff), the latest ramp was to be expected, but appears to be reaching an exhaustion point with just 10 points to go until resistance is hit.
There is another technical reason (we’ll ignore fundamentals because when the Fed continues to inject $120BN per month and when the joke cryptocurrency Dogecoin goes exponentially higher “just because”, it’s clear that fundamentals don’t matter), the rally may be coming to an end: as of this moment a near record 96% of S&P stocks are trading above their 200DMA, which is the highest in more than 20 years, and the last time it happened – in Sept of 2009…
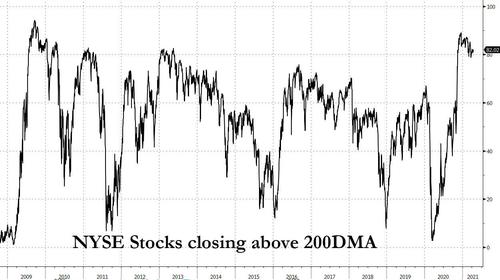
… the S&P was 5% lower in 2 weeks, and unchanged a year later. Then again, the current period – when central banks are openly PPTing everything and will defend stocks at any and all cost – can’t really be compared to any other period in the past. Offsetting the negative charts is the well-known fact that April is historically the strongest month for stocks, green 89% of the time over the past 10 years and 75% of the time over the past 20.

Another factor will be earnings season why by all counts will be stellar… but probably not stellar enough as absolute perfection is already priced in as recent bank earnings demonstrated.

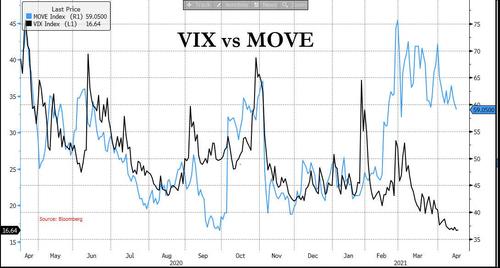
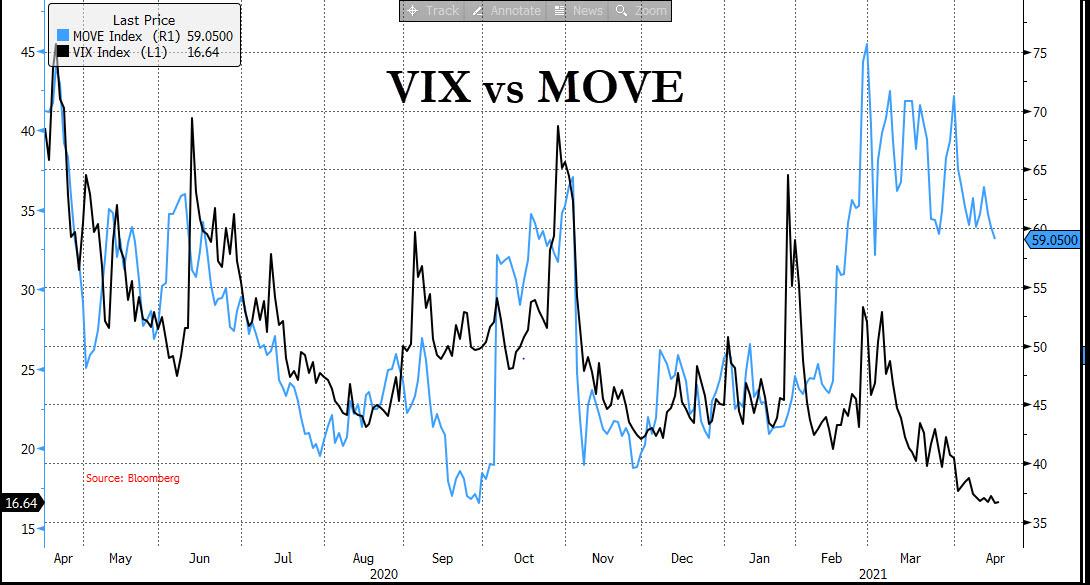
Which may explain why in his Friday Market Intelligence note, JPMorgan’s Andrew Tyler writes that while the “bull case remains intact” he warns to “keep an eye” on growing divergence in the sleep VIX relative to the spiky MOVE Index (which would imply a VIX in the mid-30s)…
… as well as the CBOE’s put/call ratio…

… as “the combination seems to suggest an increasing nervousness among investors.”

As Tyler adds, “this dovetails with client conversations that, while expecting a robust earnings season, increasingly worry about potential market pullback in May/June” and urges his readers to recall that last week none other than JPM’s resident in house Marko Kolanovic recommended staying long risk but adding hedges.

Share This Article

  • Share
  • Twitter
  • LinkedIn
  • Reddit
  • Facebook

Written by developer · Categorized: Market Analysis · Tagged: JPM

Don’t have an account with SpotGamma?

Choose the plan you want today to view unique support and resistance levels, access Founder’s Notes and expert commentary, daily trading ranges, and entrance into our private Discord.


Primary Sidebar

Related Resources

  • Options Exchange Monitor — Week of August 15, 2026 (36 SEC notices, 2 CFTC, 0 EDGAR)

    Options Exchange Monitor — Week of August 15, 2026 (36 SEC notices, 2 CFTC, 0 EDGAR)

    August 17, 2026
  • GEX Levels for SPY, QQQ, ES and NQ: Using Index Gamma in Any Product

    GEX Levels for SPY, QQQ, ES and NQ: Using Index Gamma in Any Product

    August 17, 2026
  • How to Trade GEX Levels: A Practical Guide to Gamma-Based Trading

    How to Trade GEX Levels: A Practical Guide to Gamma-Based Trading

    August 17, 2026
  • Free GEX Levels, Charts, and Data: What’s Available and What It’s Actually Worth

    Free GEX Levels, Charts, and Data: What’s Available and What It’s Actually Worth

    August 17, 2026
  • Covered Calls After Assignment: What to Do When the Stock Drops Below Your Cost Basis

    Covered Calls After Assignment: What to Do When the Stock Drops Below Your Cost Basis

    August 17, 2026
  • youtube
  • x
  • Privacy Policy
  • Disclaimer
  • Terms & Conditions
  • Support Center
  • Media
  • Contact Us

©2026 TenTen Capital LLC DBA SpotGamma

All SpotGamma materials, information, and presentations are for educational purposes only and should not be considered specific investment advice nor recommendations. Futures, foreign currency and options trading contains substantial risk and is not for every investor. An investor could potentially lose all or more than the initial investment. Risk capital is money that can be lost without jeopardizing one's financial security or lifestyle. Only risk capital should be used for trading and only those with sufficient risk capital should consider trading. Past performance is not necessarily indicative of future results. Testimonials appearing on this website may not be representative of other clients or customers and is not a guarantee of future performance or success.

View Full Risk Disclosure