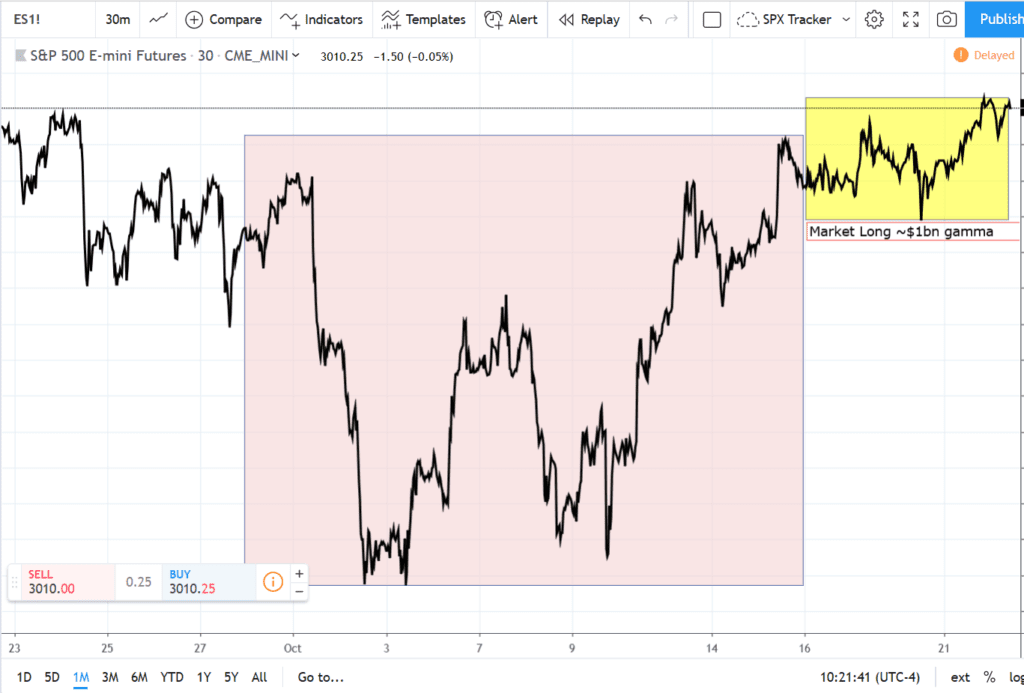
Here is a quick example to illustrate how market gamma may be useful for a futures trader. The last week SpotGamma has calculated a very large amount of gamma in the market, north of $1 billion. That predicts a tight, range-bound market. Below is a chart of the last month, the yellow box highlights a market with very high gamma, and the red box is low to negative gamma. As you can see the yellow box is a tight, mean reverting range. The red box shows large swings. Knowing market gamma may therefore help determine trading levels and pivots for your futures trading.

Check out the backtest for a larger data set. For our subscribers we publish real time gamma readings which may help determine what type of strategy you should use, or how to adjust your current strategy to account for gamma.
