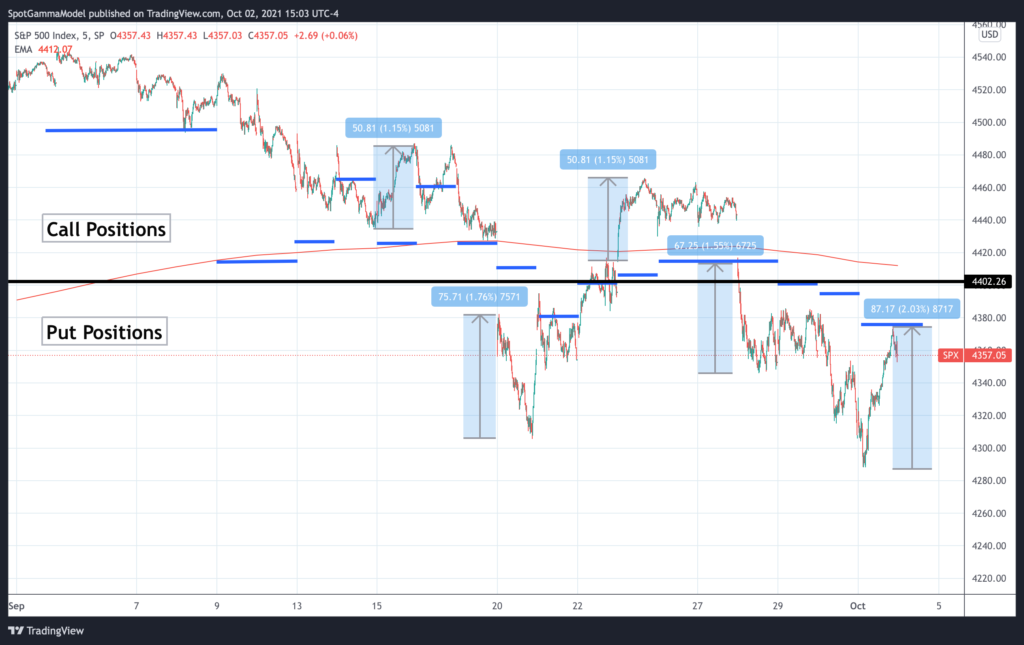
September has a few spurts of volatility, particularly around 9/20/21 September options expiration, and the 9/22 FOMC. One of the primary metrics we produce for traders is our “volatility trigger”, which defines where we believe options dealers position flips from a positive gamma position, to a negative gamma position. We’ve plotted out this level in blue in the chart below. Above this line we anticipate markets have relatively low volatility due to dealers needing to short futures as the market goes up, and buy futures as the market goes down (aka positive gamma hedging).
Below the blue lines (ie negative gamma positions) dealers may be shorting futures as the market goes down, and buying as the market goes up. This could expand the movement of the market, because these big dealer desks are pushing the movement with their trading.
This is apparent in the chart below, you can see that as the market breaks below our Volatility Trigger level in mid to late September the markets movement becomes much larger. In other words, volatility breaks out.

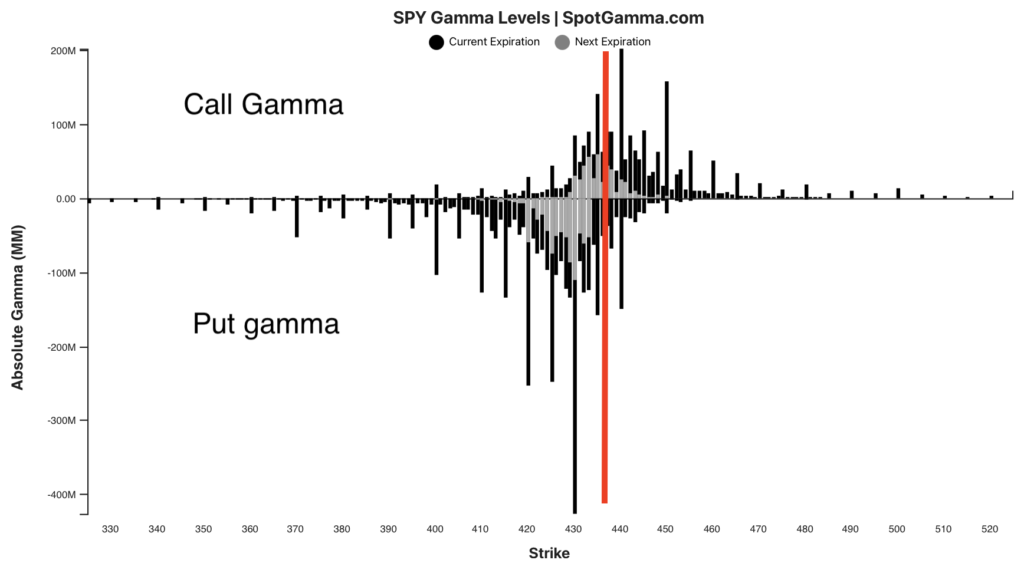
There is another way to think about this, regardless of hedging position. If you look at the chart below, we’ve plotted out the amount of call gamma and put gamma by strike. In our models call gamma carries positive gamma, and puts carry negative gamma. You can see that above ~440 (right of the red line) in SPY (4400 SPX) the positions carry primarily call gamma. Below 440 its nearly all large put gamma which is due to big put options positions.
In other words, the volatility trigger is simply telling us that the market has moved from embedded primarily in call options, to primarily in put options.

Whats interesting about put options positions is that they are much fore sensitive to implied volatility than call options. Therefore traders need to be more active in trading them, which could lead to more frequent adjustments to dealer hedging. We believe this is what sparks the large, volatile swings that we see when gamma turns negative.
