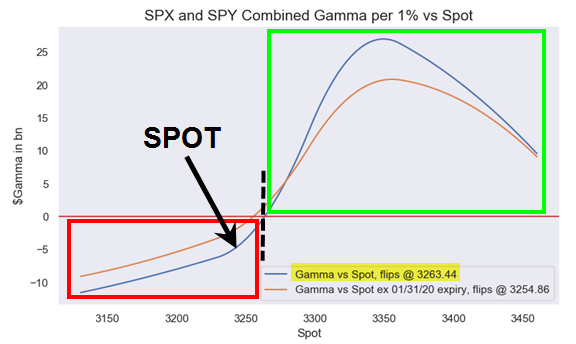
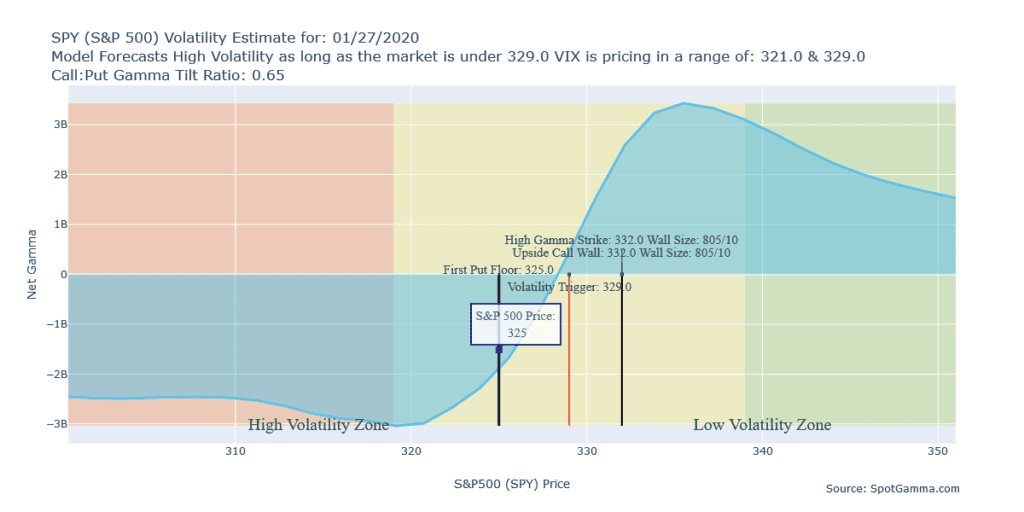
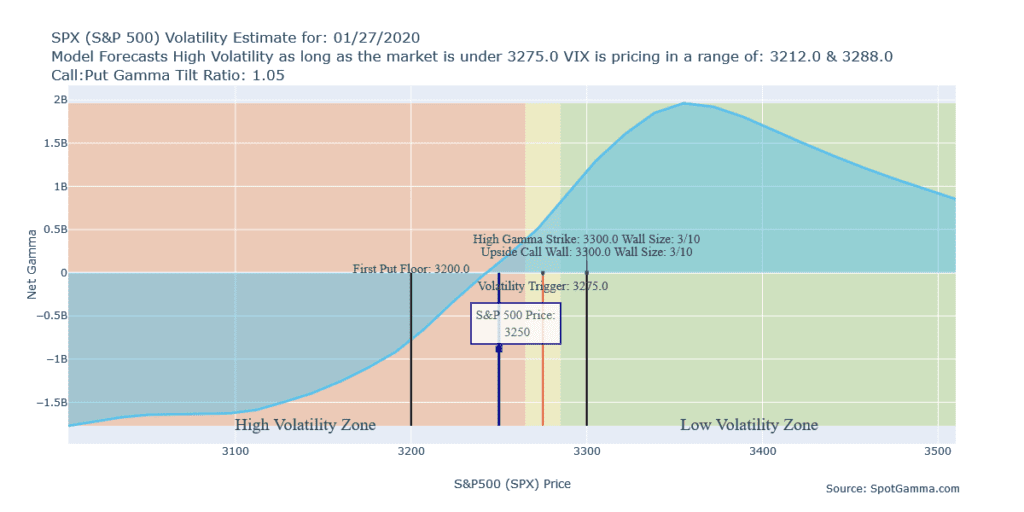
Here are the Nomura gamma charts via ZH. Not their flip point at 3263, id argue this is too high. Nomura combines SPY and SPX and I believe they can have very different profiles. Compare the Nomura gamma chart with our separate SPY and SPX charts.

The zero gamma level on our charts is where the curved blue line crosses 0. Note for SPX thats about 3240 and SPY it was 328.


