SpotGamma just completed a comprehensive statistical review of two of our key metrics: the Call wall and Put wall. These levels reflect very large concentration of call gamma, and put gamma respectively. Our working thesis is that the Call Wall provides stiff resistance to the S&P500, and works as a “cap” to prices.
Conclusion:
Call Wall: despite the market spending most sessions within 0.5-2% of the Wall, its only breached on 17% of sessions. Furthermore we find a notable correlation between the wall shifting higher, and markets following. This backs our view that the level is a resistance point, and that when the wall shifts higher it is an indicator that markets have room to rise.
Put Wall: we find that the Put Wall tends to shift much more frequently based on the distribution. The most significant signal appears that when the Put Wall shifts higher, equities push higher in the next 2-3 sessions. We believe this is a function of put options being closed, and dealers buying back short deltas.
We view the Put Wall as a major support line for markets, because it signals a level at which traders may close large put positions.
Here is the data from over 900 trading sessions:
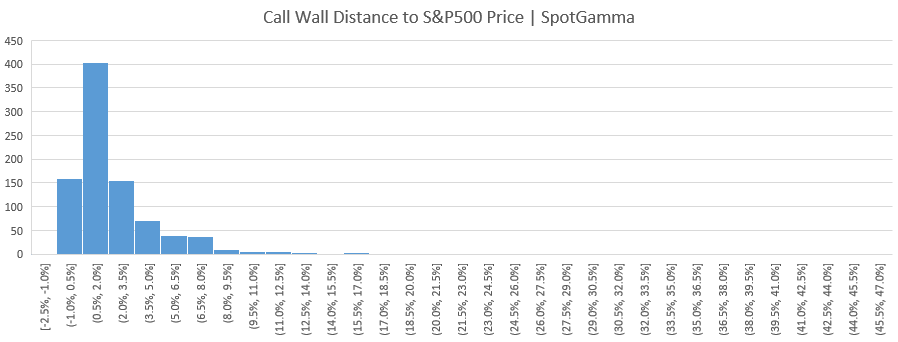
Here we show the distance between the Call Wall and the S&P500 at the start of day. You can see that the Call Wall tends to be quite close to the S&P500 price, with the bulk of data points occurring just 0.5-2%. Furthermore we find that there is a R of 0.6 Call Wall moving higher as a signal that equities will follow on the same day.
The table below outlines how often both the Call Wall and Put Wall have been breached. We see that the Call Wall was broken on just 17% of sessions. The data shows that 68% of the time the market closes above the wall, once breached. Out of the 105 times the S&P closed above the wall, 61% of those closes are within 50bps. In other words, its only on 4.8% of sessions that the Call Wall is breached with any significance.
We also note that the most significant breaches occurred after major market drawdowns. For example 5 of the largest breaches occurred during March of ’20 when the Call Position was quite small, and put options trading dominated flow.
| Total Breach | Intraday, Breach but Close Inside Wall | Intraday Close Outside of Wall | T+1: Close Inside | T+1: Wall Shifts | T+1: Price Remains Outside of Wall | |
| Call Wall Breach | 154 | 49 | 105 | 7 | 66 | 32 |
| Put Wall Breach | 76 | 27 | 49 | 4 | 35 | 10 |
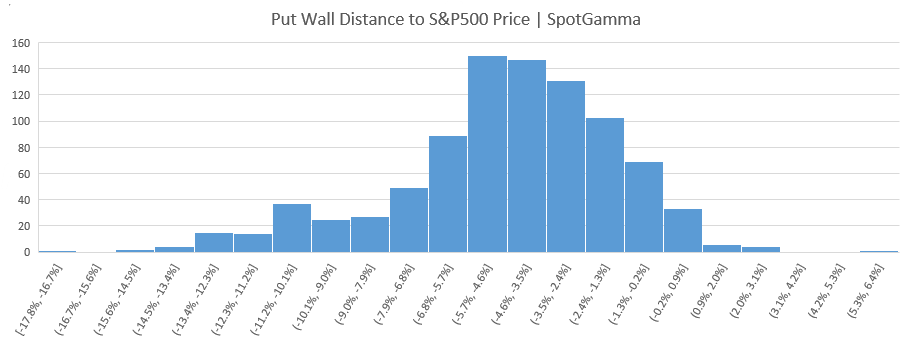
As the table above indicates, the Put Wall is breached much less often (only 8% of sessions). As you can see below the indicator tends to be much farther away from where the S&P is trading. Interestingly we see a strong correlation (R 0.62) between the Put Wall shifting higher and equities moving higher over the next 2-3 days.