What Is Dealer Hedging?
Dealer hedging describes the buying and selling of an underlying asset by options dealers (market makers) to remain directionally neutral after taking the other side of customer’s options trades. This mechanical activity produces predictable flows that can shape support, resistance, and volatility in the underlying asset.
Dealer hedging is a continuous, rules-based process by which market makers provide liquidity to other participants while limiting their own portfolio risk. The main mechanism used for this is delta hedging, where dealers monitor their hedges by constantly observing options greeks.
Because dealers hold such large overall positions, their hedging behavior exerts a sizeable impact on the underlying asset. Traders can read this impact to understand specific market phenomena, such as price breakouts or reversals. For this reason, understanding dealer hedging is critical for day and swing traders — even if they do not trade options.
Who Are Options Market Dealers?
Options market dealers are firms who continuously quote bid and ask (buy and sell) prices for options, providing crucial liquidity for the market. These groups capture the spread between the two quotes across millions of trades every single day.
This business model only works if these dealers insulate themselves from directional risk: taking on directional exposure could potentially cause massive losses. Dealers therefore aim to remain delta-neutral (directionally neutral), which means that their profit should not materially change when price moves up or down.
Maintaining neutrality is not optional for these dealers: it is a structural requirement of operating as a market maker without carrying excessive directional risk. Because of this, their hedging activity is mechanical and can be tracked once you understand the positions they hold.
How Options Dealers Hedge
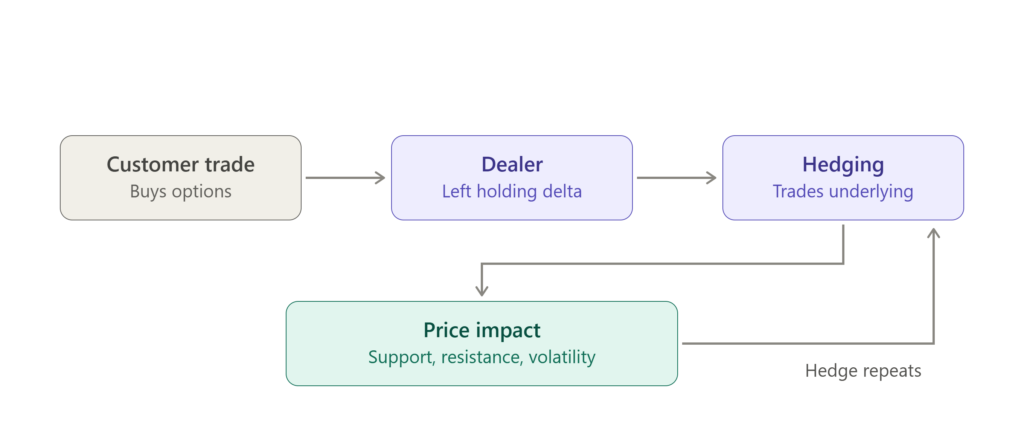
Dealer hedging is the process that options dealers use to counterbalance the directional risk they take on when they provide liquidity to the markets. When a dealer takes the other side of a customer’s options trade, they are left holding a position with directional exposure they do not want. For example, if a trader buys a call option, the dealer writes the contract and sells that call option to the trader.
To offset potentially infinite risk when trading options, options dealers buy or sell the underlying asset (stock, ETF shares, or futures contracts). This process keeps their overall position close to directionally neutral.
Keep in mind that dealers sit on the opposite side of most retail and institutional options transactions. The aggregate of the positions held by dealers — and the hedges those positions require — creates a current of buying and selling activity in the underlying asset which traders can anticipate. This is where market maker hedging and options dealer positioning become central to how markets actually move.
Options Market Delta Explained
To understand how dealers hedge, we must start with delta. Delta measures how much an option’s price will likely change for every $1 move in the underlying. A call option with a delta of 0.50 gains roughly $0.50 in value for every $1 the stock rises. Because each standard contract covers 100 shares, that single call carries the directional equivalent of 50 shares of stock.
Crucially, delta is not just a description of the option, it is the hedge ratio. That 0.50-delta call behaves like 50 shares, so a dealer who wants to offset this position must trade 50 shares against it. When a dealer ends up holding options, those options carry delta the dealer must mitigate. Delta hedging describes the act of taking an opposite position in the underlying to bring the position’s net delta back to zero.
When totaled across a dealer’s entire book, aggregate delta shows you how much directional exposure dealers are carrying. This also shows how much that dealer may need to buy or sell as price moves.
Example of Delta Hedging
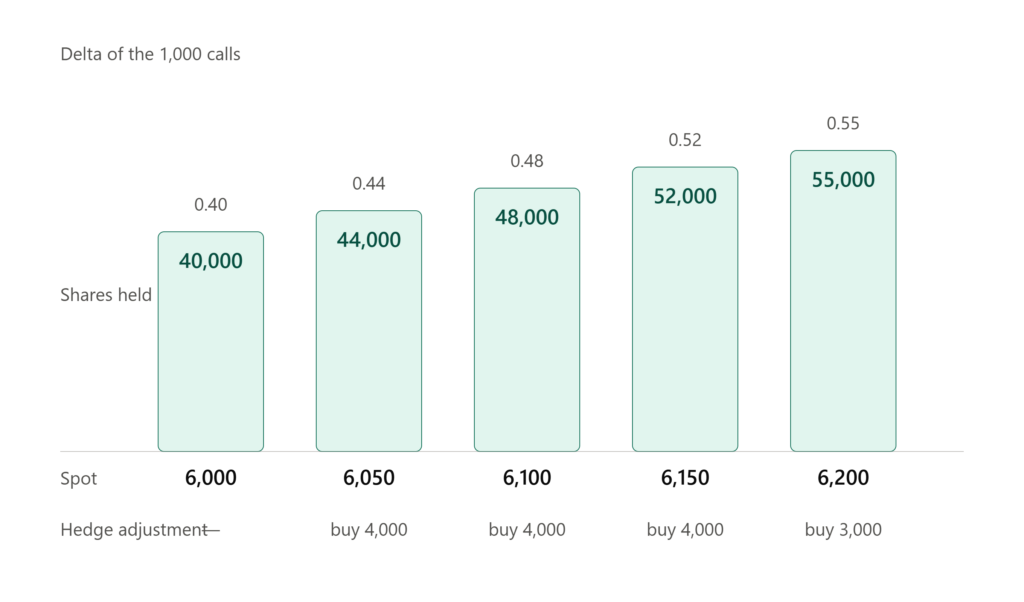
Let’s consider a fairly straightforward case. A customer buys 1,000 SPY call contracts, each contract with a delta of 0.40 and covering 100 shares.
The dealer sells those calls to the customer, and is now short 1,000 SPY calls. A short call position carries negative delta, meaning the dealer loses money as the underlying rises. To calculate the exposure:
- Delta per contract: 0.40 × 100 shares = 40 shares of directional exposure.
- Total position: 40 × 1,000 contracts = 40,000 shares of negative delta.
To neutralize this, the dealer buys roughly 40,000 shares of the underlying asset (or the futures equivalent). Now the position is delta-neutral: if the market ticks up, the dealer’s gain on the shares offsets the loss on the short calls.
Delta Hedging Is Dynamic
The delta for an options trade is not static. As the underlying price rises, the delta of those calls increases (say from 0.40 towards 0.55) as the options move closer to in-the-money. The dealer’s short-call exposure now grows, so they must buy even more underlying shares to stay neutral. As price falls, the delta shrinks, and the dealer sells underlying shares back. Because of this “soft delta” (not fixed) behavior, the market makers must continuousy rebalance their trades as price moves.
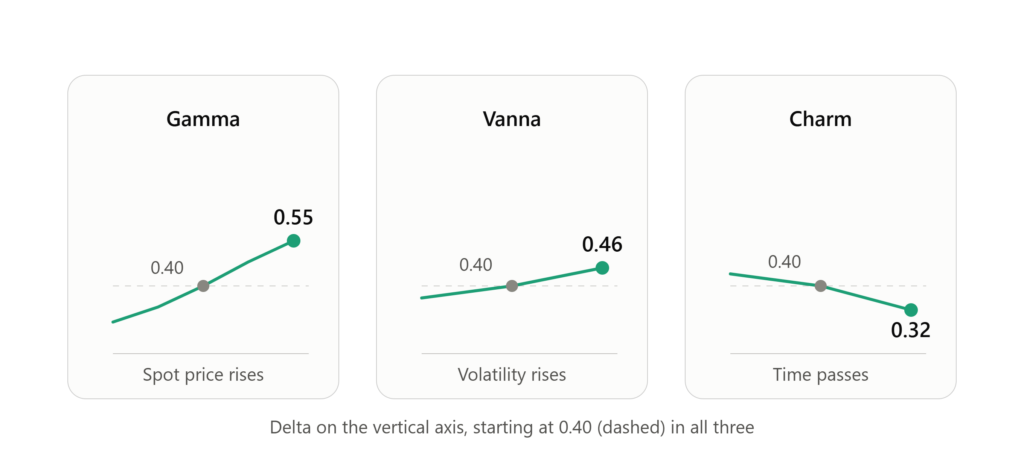
The earlier example above hints at the key point: a hedge is never a single, finished trade. Because an option’s delta shifts as price, time, and volatility change, the dealer’s required hedge changes dynamically. Three specific options greeks govern how and why delta changes, and therefore why dealer hedging is a constant process.
| Greek | What it measures | Why it drives continuous hedging |
|---|---|---|
| Gamma | How much an option’s delta changes for each $1 move in the underlying asset. | When gamma is high, delta shifts rapidly and dealers must re-hedge aggressively even on small moves. It sets the intensity of hedging. |
| Vanna | How an option’s delta changes as the implied volatility of the option changes. | When implied volatility moves, delta moves with it, so dealers must re-hedge in response to changes in implied volatility. |
| Charm | How an option’s delta changes as time passes (time decay of the option). | Delta for an option changes as the contract approaches expiration, meaning dealers must adjust their hedges into expiry. |
Market Impact of Dealer Hedging
Together, gamma, vanna, and charm inform traders why delta hedging is never complete. Changes in price, time-to-expiration, and implied volatility forces dealers to constantly re-hedge their positions. This continuous rebalancing often moves the underlying assets, including major indices, ETFs, and stocks with sizeable options volumes.
Gamma Exposure
The continuous rebalancing of dealer positions has become a measurable force on price. The aggregate picture here is captured by Gamma Exposure (GEX), which maps where dealer hedging is concentrated across strikes. This describes the direction and magnitude that dealers must hedge as the price of an underlying asset changes.
When dealers are net long gamma (positive gamma exposure), they hedge against price action: they sell the underlying as price rises and buy as it falls. This in turn dampens movement in the underlying asset and compresses realized volatility.
When dealers are net short gamma (negative gamma exposure), the flow flips: dealers buy as price rises and sell as it falls. This process can accelerate movement and expand realized volatility, producing wider trading ranges.
Depending on the gamma regime, the same headline news can deliver different market reactions. In a positive gamma environment, major announcements or data prints could be absorbed as dealers hedge against price movement. In a negative gamma environment, price could react violently to relatively small events.
Key Levels
Dealer hedging pressure is not spread evenly and often clusters at specific strikes, which creates tradeable key levels. These serve as specific price points of support and resistance, where dealer hedging is likely to dampen movement against the level.
Where dealers are net long calls at a heavily traded strike, their hedging sells into rallies toward it and can cap price, forming a Call Wall that acts as resistance. Where they are net long a heavily-traded put strike, their hedging buys into declines toward it and can support price, forming a Put Wall. The important caveat is that these levels depend on which side dealers actually hold: the same strike that caps price in one positioning scenario can accelerate straight through it in another, which is why estimating dealer positioning is absolutely key. For the full detail on these levels and how to trade around them, see our guide to options key levels.
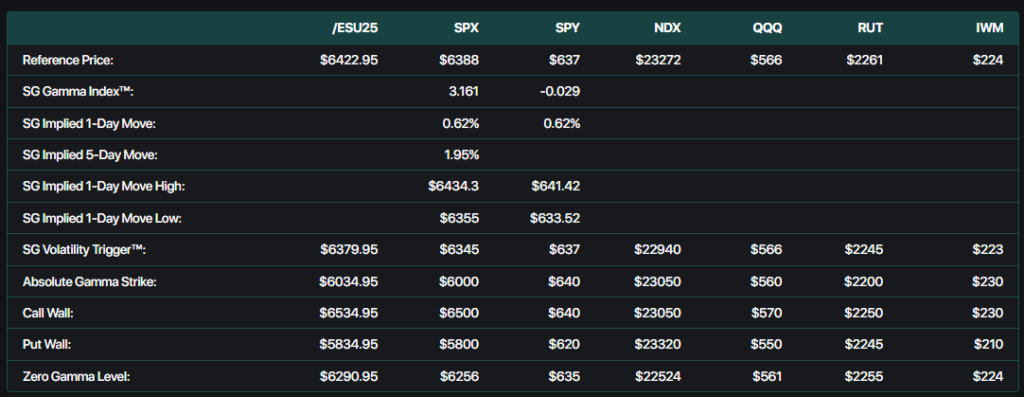
Image from the SpotGamma daily Founder’s Note, displaying key levels for major indices.
What Traders Should Watch
Traders should understand dealer hedging to identify setups and market risks. Below are specific reasons traders should track dealer hedging activity.
- The gamma regime: Establishing whether dealers are net long or short gamma can reframe potential trade setups. A positive-gamma regime favors mean reversion and limited price action, while a negative-gamma regime favors momentum trades and breakouts.
- Support and resistance levels: Traditional technical levels derive from past price behavior, while dealer-hedging levels are based on anticipated buying and selling from dealers. This creates mechanical support and resistance levels that can hold price in a relatively narrow trading range.
- Timing around events and expirations: Options expiration removes large blocks of positioning from the board, which can abruptly change the hedging landscape. A heavily-hedged expiry rolling off can mean yesterday’s magnet strike holds no relevance the next day.
- Risk and position sizing: Even for traders who never touch options, dealer positioning can help forecast volatility: a negative-gamma regime warns that realized volatility may expand and that stops need more room, while a positive-gamma regime suggests calmer conditions.
Dealer hedging provides a structural read on structural pressure points, zones of heightened volatility, and levels where price may pin or breakout.
Reading Dealer Hedging
Because individual dealer books are not public, dealer positioning must be estimated in aggregate using open interest. Open interest refers to the total number of options contracts, both calls and puts, that have not yet been closed, exercised, or expired.
Open interest is reported only after the market closes, so traditional methods of calculating dealer positions are static pre-market snapshots baesed on assumptions around whether options contracts were bought or sold by dealers.
SpotGamma Tools to Understand Dealer Hedging
SpotGamma analytics allow you to see the impact of dealer hedging, both pre-market and in real time. Using our Options Inventory Model, each participant position is estimated — bypassing more naive assumptions around which positions dealers hold.
Equity Hub publishes dealer positioning and key levels for over 3,500 stocks, so you can see where each name’s gamma concentrates rather than inferring it by hand. This includes SpotGamma’s Synthetic OI model that isolates dealer positions to calculate gamma, delta, and net open interest.
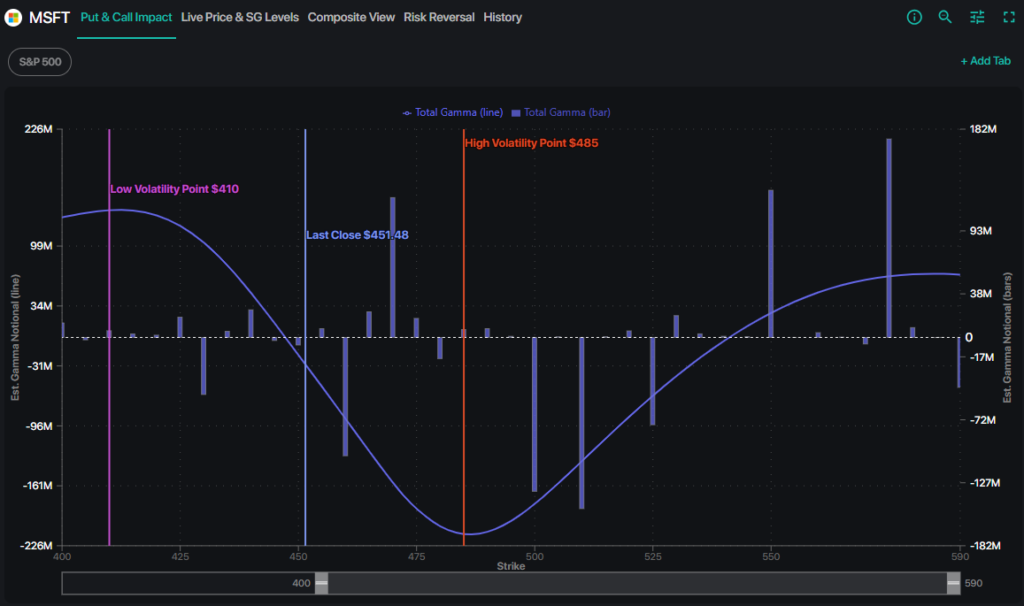
Image from inside Equity Hub, displaying key levels and GEX zones for Microsoft.
TRACE visualizes dealer hedging for the S&P 500 with 1-minute updates. By calculating SPX options (the most commonly traded options instrument), TRACE maps the three forces behind continuous dealer hedging:
- Gamma: Where dealers hedge with price action (red) or against price action (blue)
- Delta Pressure: Where net dealer activity is likely to induce buying (blue) or selling (red)
- Charm Pressure: How dealer hedging changes into the close, including potential pinning levels
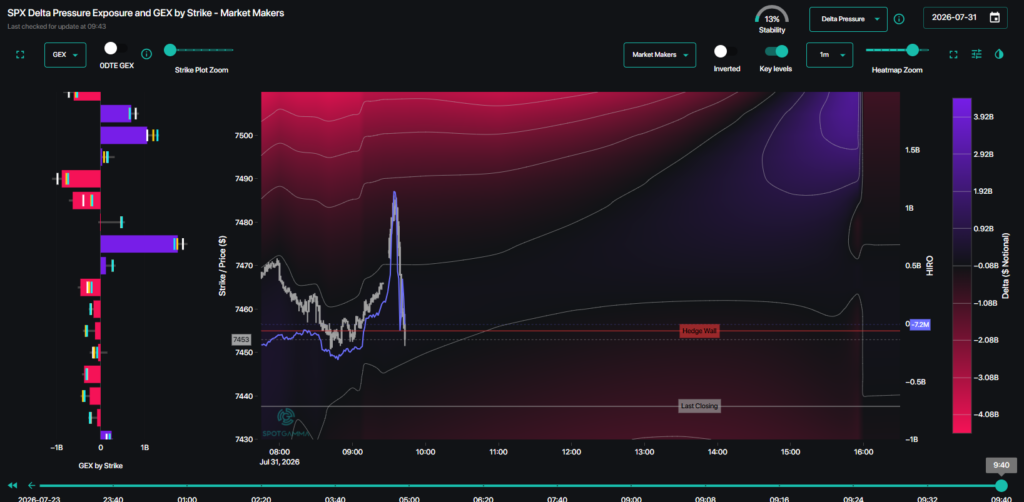
Image from SpotGamma TRACE, displaying GEX strike bars and the Delta Pressure heatmap.
HIRO measures the net delta being transferred to dealers in real time. HIRO displays the hedging flows associated with dealer activity to produce an aggregate indicator of live buying and selling pressure.
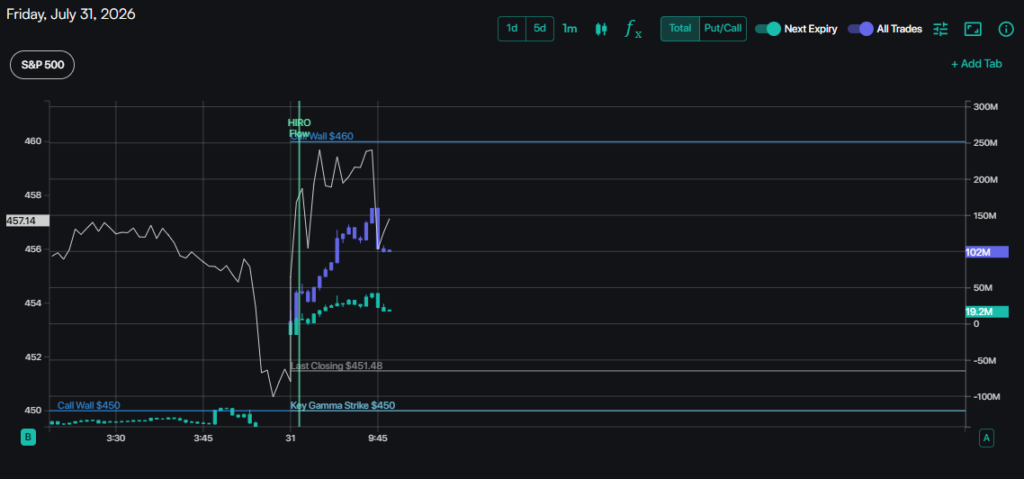
Image from inside HIRO, displaying real time hedging flows for both all expiry and 0DTE positions, as well as key levels.
Subscribe to SpotGamma
Every SpotGamma plan includes the Total OI Model and key levels for 3,500+ US stocks, ETFs, and indices, along with the daily Founder’s Note and live options data via Tape. We also support our community with multiple weekly sessions providing market analysis and education, alongside an engaged Discord community.
Essential Membership
For active traders who want the key dealer-positioning levels and daily market structure briefing.
- Daily Founder’s Note (morning and evening)
- Key Levels: Call Wall, Put Wall, Zero Gamma, Volatility Trigger
- SPX/SPY/QQQ/IWM GEX charts
- Equity Hub: Proprietary daily dealer positioning for +3,500 stocks
- Options Calculator
- Education Library
- Tape: real time options prints in +3,500 stocks
- Multiple live training sessions each week
Alpha Membership (Most Popular)
For intraday, options, and futures traders who need the deepest, real-time dealer hedging data.
- Everything in SpotGamma Essential
- TRACE: Intraday SPX hedging heatmaps updated every 1-minute
- 0DTE strike plot and key levels
- Gamma, Delta & Charm Pressure heatmaps
- Synthetic OI Model: Proprietary positioning for 3,500+ names
- HIRO: Real-time hedging impact for options-driven stocks, ETFs, and indices
- Advanced Volatility Dashboard
Dealer hedging mechanically influences price, and SpotGamma is built to show you where it flows. Trusted by thousands of traders, you can see plans at spotgamma.com/subscribe.
Dealer Hedging FAQ
What is dealer hedging in simple terms? Dealer hedging describes how options market makers cancel out unwanted directional risk. When they take the other side of a customer’s options trade, they buy or sell the underlying asset to keep their net directional exposure near zero, and they adjust that hedge continuously as price moves.
What is the difference between dealer hedging and delta hedging? Delta hedging refers to the main mechanism used to hedge, offsetting an option’s delta by trading the underlying. Dealer hedging refers specifically to market makers deploying delta hedging at scale. Individual traders can delta hedge too, but dealer hedging is what moves markets because of its aggregate size.
Why do market makers hedge? Market makers profit from the bid-ask spread, not from speculating on direction. Staying delta-neutral lets them provide liquidity across huge volumes without taking on directional risk, which is why their hedging trades aremechanical rather than discretionary.
What is the difference between delta and gamma? Delta measures how much an option’s value changes for a $1 move in the underlying. Gamma measures how much that delta itself changes for a $1 move. For dealers, delta calculates the size of the hedge, while gamma calculates how fast the hedge has to change as price moves.
What are vanna and charm? Vanna measures how an option’s delta changes as implied volatility changes. Charm describes how delta changes as time passes. Along with gamma, these two greeks explain why dealer hedging is continuous: price, volatility, and time all move throughout the session and each causes delta to change.
What is delta exposure (DEX)? Delta exposure is the aggregate directional hedging requirement across all dealer positions, the net amount dealers must buy or sell as price moves. It summarizes the directional pressure dealer hedging places on the underlying.
Do dealers always hedge their positions? Dealers manage risk toward delta-neutrality as a rule, but the exact timing, venue, and instrument can vary, and some exposure may be offset elsewhere. This is why models estimate dealer positioning rather than claiming to observe it precisely.
Can I see dealer positioning directly? No. Public data shows how many contracts are open, not who holds each side or whether it is hedged elsewhere. Dealer positioning must be estimated, which is what SpotGamma’s Options Inventory Model is built to do.
How does dealer hedging relate to gamma exposure (GEX)? Dealer hedging is the action dealers take, while GEX is the aggregate map of where the gamma driving that action sits across all strikes. Dealer hedging explains the mechanism, and GEX helps you see the broader picture for how dealer behavior impacts price action.