S&P 500 Stock Market Gamma Trading Levels Based on Options Open Interest
Options flows blocking a market breakout
Monday
January
01
1999
Try SpotGamma HIRO Indicator for Free
Real-time options data
See when options drive stocks
0DTE filter for short-term trades
Subscribe to the industry's #1 platform delivering daily expert analysis to unveil:
Proprietary market levels
Bullish or bearish stocks
Hidden trading risks

The following is a guest post courtesy of Michael Kramer of Mott Capital Management.
Key Takeaways
The impact of options flows
Over the past few weeks, the options flows have played a crucial role in driving the market and have been the primary factor behind the stock market's confinement within a narrow range. These options flows have been influential in keeping the market range bound. As long as these option flows remain unchanged, the market may experience this tight range for some time longer, with the next opportunity to shift coming after the May options expiration.
Access today's Founder's Note for FREE!
Expert commentary packed with proprietary key levels, major support and resistance targets, and market analysis.
By subscribing, you agree with our Privacy Policy and provide consent to receive updates from our company.
Option flow dominates trading
The Volatility Trigger level can serve as both support and resistance and, more importantly, can mark where hedging flows can shift from supporting the market to trading with the market. Meanwhile, the Key Gamma Strike is the level with the greatest concentration of gamma.
The importance of these levels is apparent when viewing them in action on the SpotGamma HIRO Dashboard. For example, on May 11, the S&P 500 traded lower during the session to the Hedge Wall, which has a similar impact to the volatility trigger. The index found support when the index reached that hedge wall at 4,115. That level found support because option delta flows shifted from negative to positive in the morning and mid-afternoon sessions.
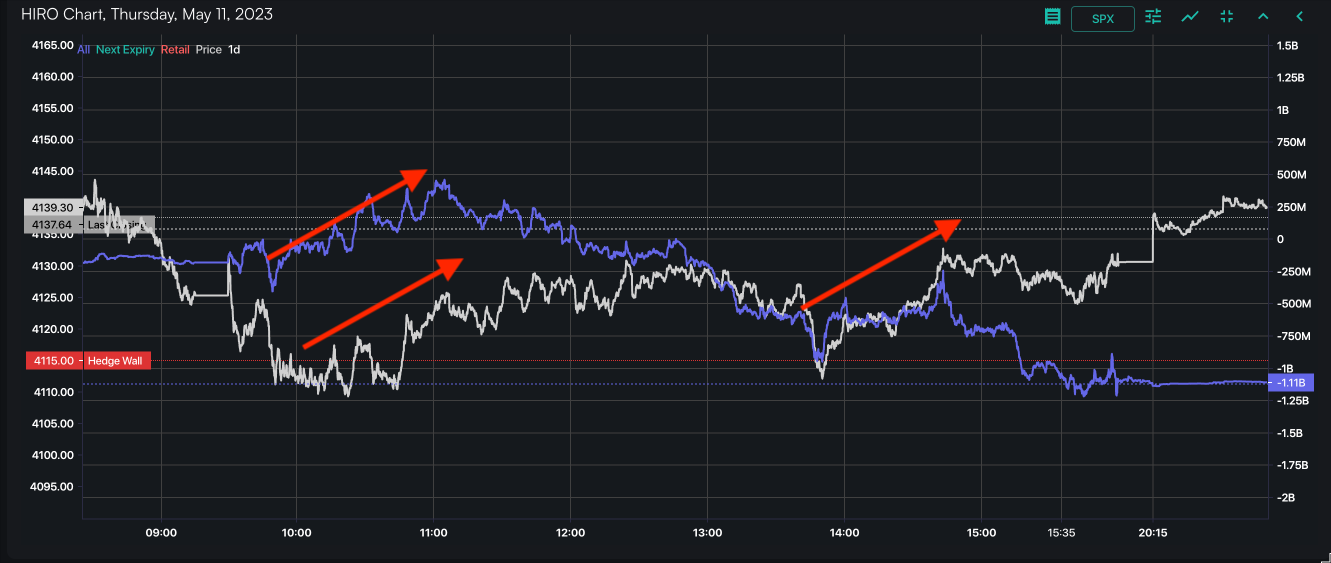
SpotGamma HIRO: The red arrows show the rising delta flows and the rising market off the hedge wall
In addition to the levels on the S&P 500, the options flow on the S&P 500 ETF, the SPY, has also played a significant role in preventing the overall market from rising. The data reveals that while the call wall on the S&P 500 has been situated around 4,200, the Call Wall and Hedge Walls for the SPY have been observed at levels ranging between $413 and $420. Generally, when the SPY approached the $414 to $415 range, option delta flows tended to decline or could not maintain positive momentum. This suggests a trend of selling calls and purchasing puts.
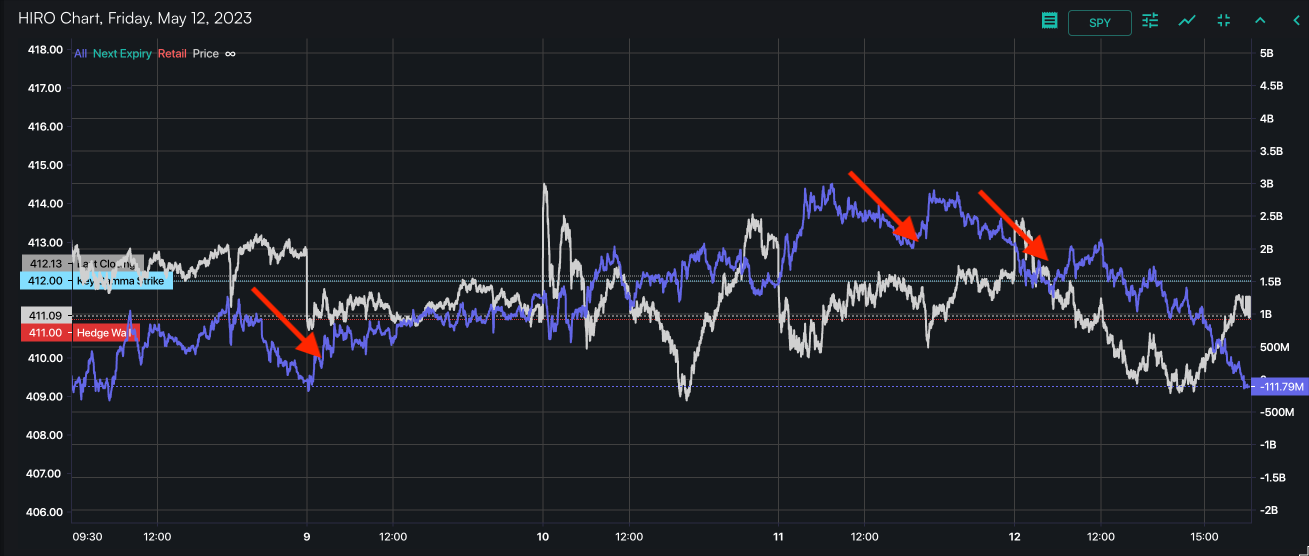
SpotGamma HIRO: The red arrows show the declining delta flows and the falling market as the SPY traded up to the $413 to $415 range
In addition to the levels on the S&P 500, the options flow on the S&P 500 ETF, the SPY, has also played a significant role in preventing the overall market from rising. The data reveals that while the call wall on the S&P 500 has been situated around 4,200, the Call Wall and Hedge Walls for the SPY have been observed at levels ranging between $413 and $420. Generally, when the SPY approached the $414 to $415 range, option delta flows tended to decline or could not maintain positive momentum. This suggests a trend of selling calls and purchasing puts.
Levels have been unchanged
According to the SpotGamma Equity Hub, the historical data reflects that the Hedge Wall, Call Wall, and Key Gamma strike levels have remained relatively stable and unchanged over the past week.
The Call Wall in the SPY has consistently been positioned at $415 or $420, while the Key Gamma Strike has always been at $410 or $412. The Hedge Wall has been observed to be between $410 and $413. As long as these levels continue to remain stable and unchanged, it is unlikely that the S&P 500 will experience significant movement.
The options flow has been relatively consistent, except for an unexpected news event or macro data that alters the market's perception and behavior.
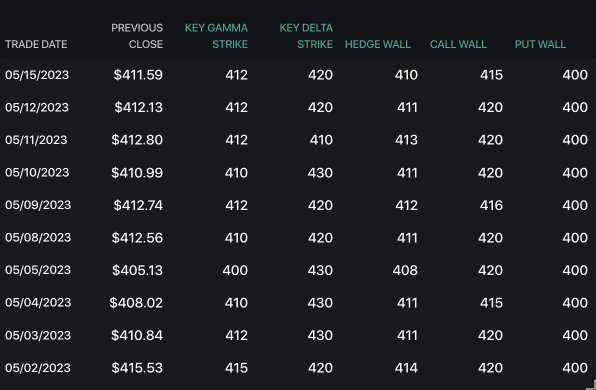
SpotGamma Equity Hub: These are the historical changes for gamma levels in the SPY
Over the past few weeks, the options flows have played a crucial role in driving the market and have been the primary factor behind the stock market's confinement within a narrow range. These options flows have been influential in keeping the market range bound. As long as these option flows remain unchanged, the market may experience this tight range for some time longer, with the next opportunity to shift coming after the May options expiration.
Supercharge your trading strategy. Subscribe today.
Subscribe to the industry's #1 platform delivering daily expert analysis to unveil:
Proprietary market levels
Bullish or bearish stocks
Hidden trading risks
