Markets hovered near all-time highs last week as traders eagerly await next week’s FOMC. The SPX traded in a tight 6,800-6,900 range, while volatility compressed to multi-month lows: VIX dropped 15% this week to 15.4, experiencing some of the lowest values since September.
This is a trend we’re watching closely: Softer demand for volatility (options) indicates muted hedging activities despite next week’s major fed rate cut decision.
0DTE straddles were as low as 38-42 bps last week, among the tightest levels possible. As we mentioned in our Thursday pre-market Founder’s Note, ultra-low implied volatility creates conditions for sharp, mean-reverting moves. This was a notable feature of the past three trading sessions, where SPX encountered drops of 30-50 bps before snapping back.
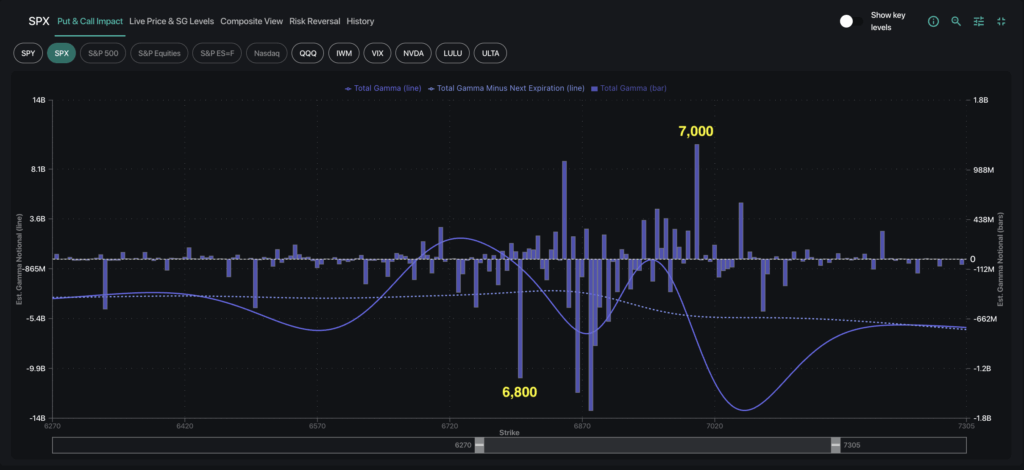
SpotGamma’s Synthetic Open Interest model shows market maker gamma mostly negative across the board, with two thin local positive gamma pockets near SPX 6,800 and 6,900. As the positive gamma was driven by 0DTE vol sellers, the zones provide some intraday support and resistance, yet the can easily shift day to day.
Traders Cautious-Yet-Optimistic on Rate Sensitive Names
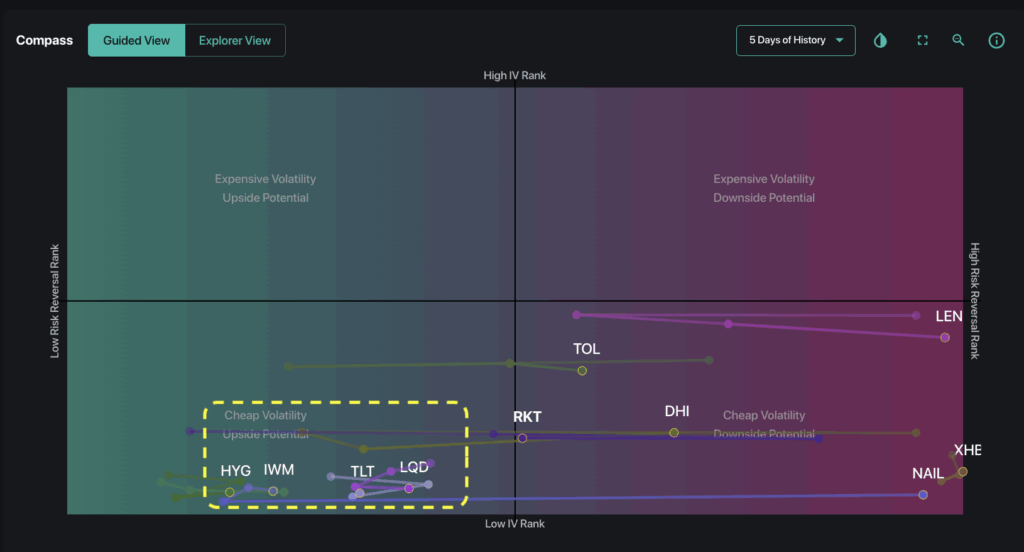
Rate-sensitive assets showed a mix of defensive positioning and opportunism ahead of the FOMC decision. Despite the low-vol environment taking shape in SPX, there was notable hedging activity throughout both credit and small-cap markets.
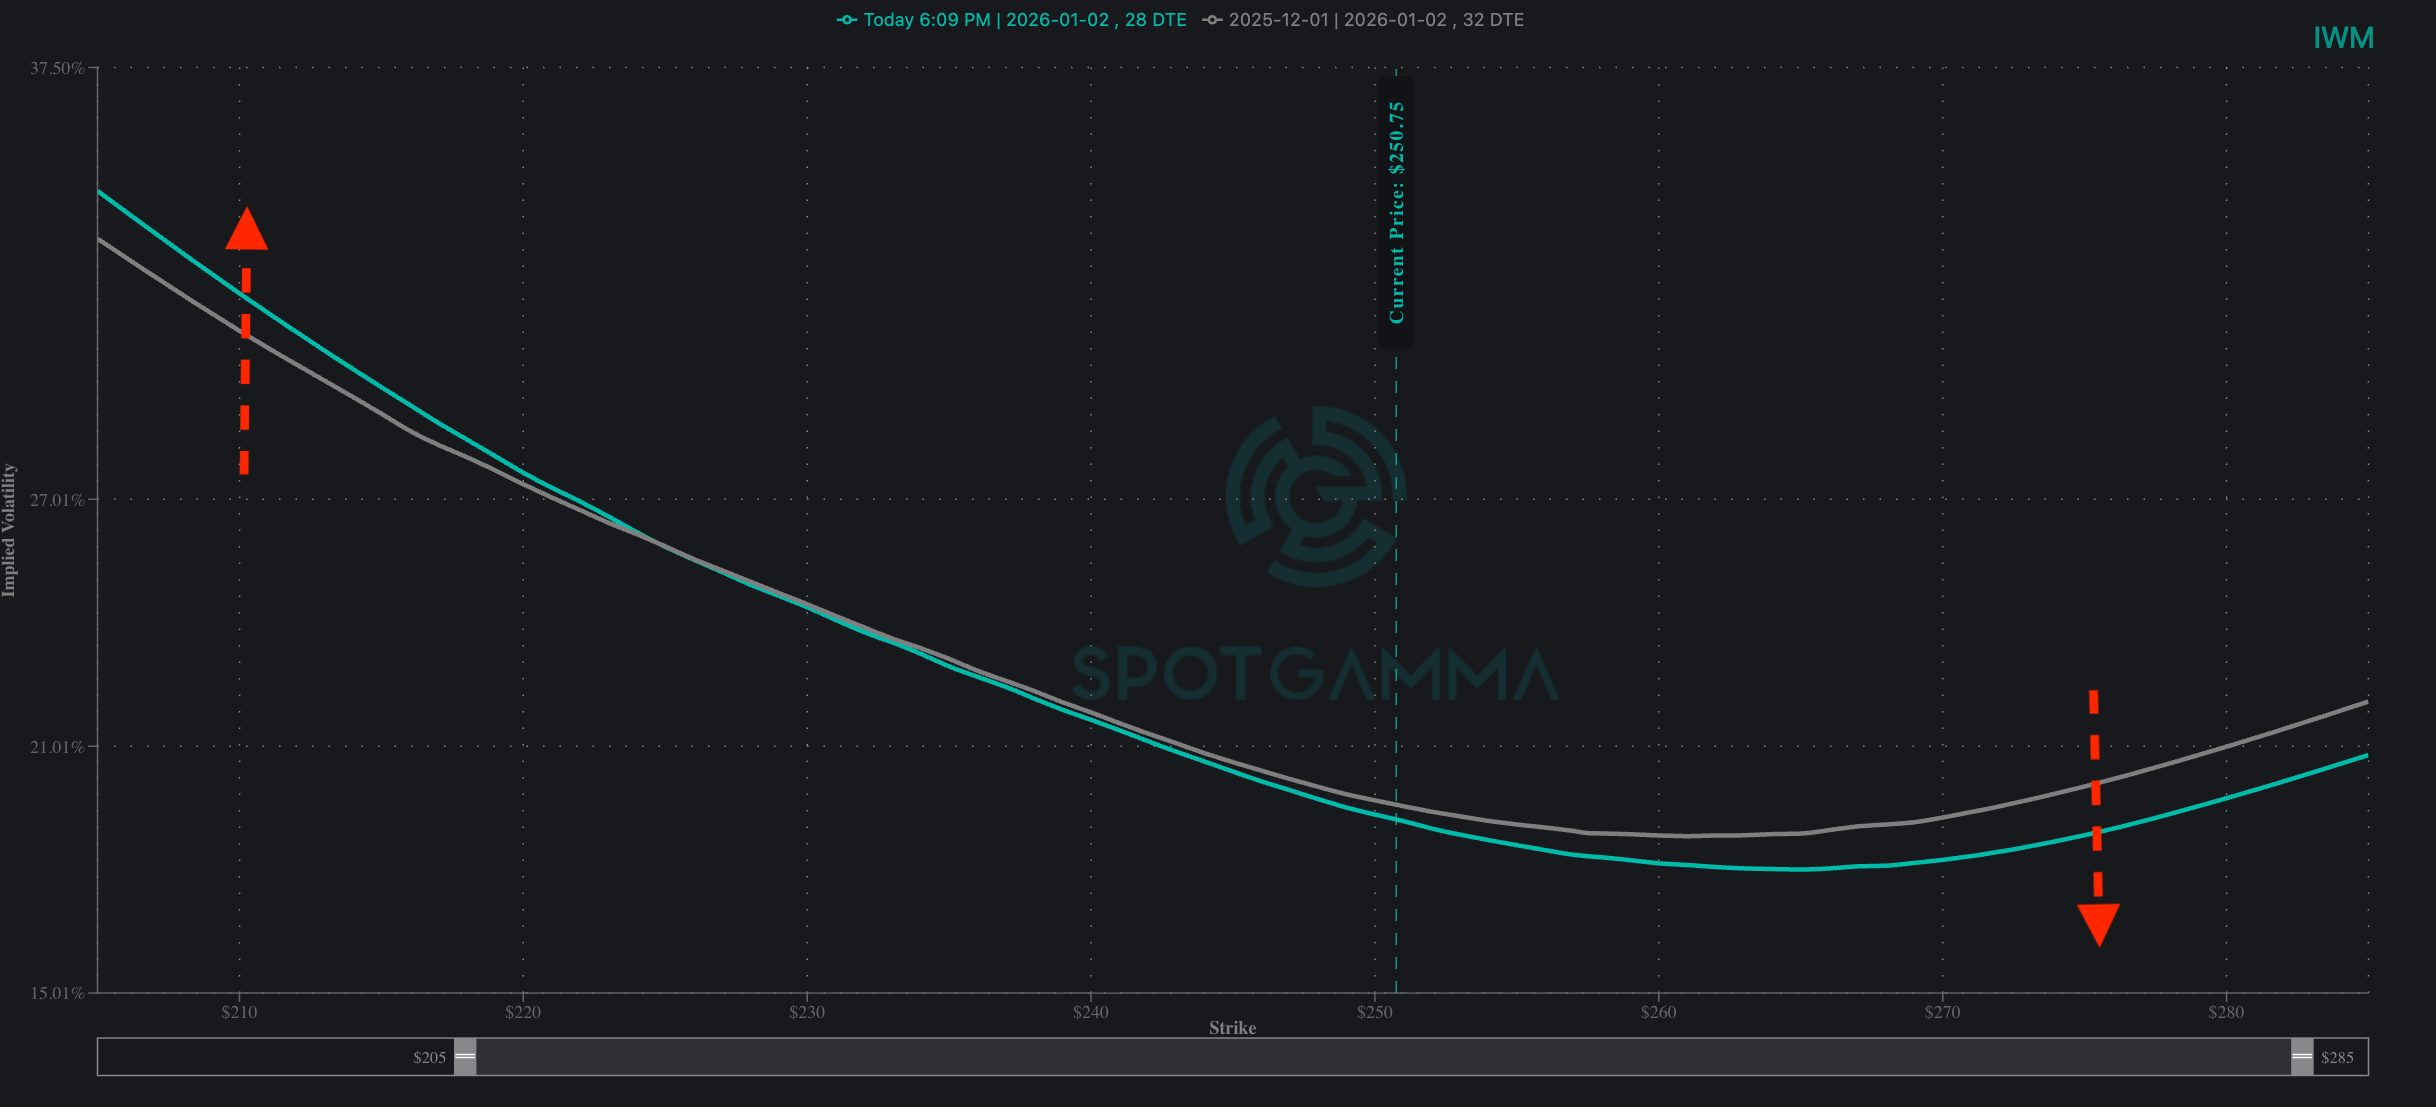
IWM experienced higher volume and bullish momentum as the index surged 2% in the past week. Volatility for IWM is quite low relative to the past year, but there are three interesting observations that point to at least some degree of trader hedging:
- A notable rise in IV on the Term Structure on the day of FOMC (12/10).
- Dispersion between IV (20%) and Forward IV (34%) for that same date.
- Rising put demand vs. call demand compared to just one week prior, as shown in the volatility skew line below.
Beyond IWM, options activity throughout other rate-sensitive ETFs pointed to cautious optimism on equities and bonds (IWM and TLT) while hedging credit deterioration risk (HYG/LQD put activity) ahead of Powell’s guidance on the pace of future rate cuts.
Looking Forward: Events That Will Shape the Rest of 2025
With 18 trading sessions left for 2025, we see a cluster of events to watch before year-end. FOMC on Wednesday (Dec 10) is the centerpiece, where rate cut odds currently stand at 87% yet uncertainty remains surrounding forward guidance. Given this uncertainty, we anticipate choppier, more volatile price action compared to this week’s tight range.
A “dovish cut” scenario—where the Fed cuts rates but maintains flexibility for future easing—would likely be most bullish for equities, which could be the clearing mechanism for elevated volatility and trigger a final year-end push toward 7,000.
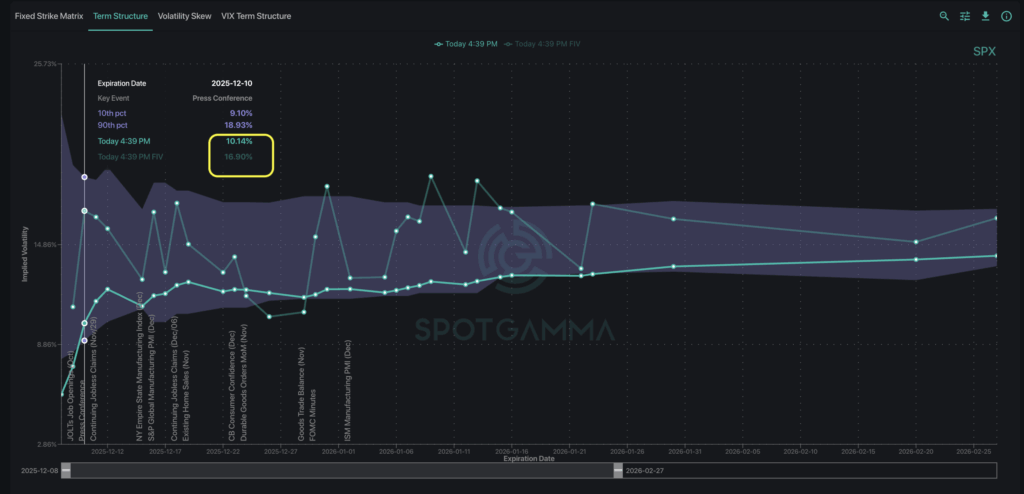
Forward Implied Volatility remains elevated above SPX Term Structure for December 10, indicating the potential for volatility to spike on the FOMC decision and speech from Fed Chair Powell.
While FOMC remains a major focal point this week, traders should watch for the impact of the following week’s Triple Witching OPEX (12/19), where over $1 trillion in delta notional is set to expire. As one of the largest options expirations ever, December’s Triple Witching has the potential to reset the volatility dynamics for the rest of 2025, and beyond into the new year.
We encourage traders to pay close attention to the impact of FOMC on volatility, watch for wider 0DTE straddles next week given the major event risk, and to size positions accordingly since a low-vol market can be prone to sudden spikes and reversals.