What Is Options Volatility?
Options volatility measures how much an asset’s price moves, or how much the market expects it to move, over a set period of time. Volatility describes the magnitude of movement rather than direction, meaning a stock with large daily swings carries high volatility regardless of whether it has trended up or down.
Traders track two versions of volatility: realized and implied. Realized volatility (RV) looks backward at price changes that have already happened for a given asset. Implied volatility (IV) looks forward at the movement the market expects for that asset.
Both implied and realized volatility appear as annualized percentages, which puts every asset on the same scale. A reading of 20% describes a pace that produces a 20% swing over the course of a year.
Options prices respond directly to these figures. A contract only pays out at expiration if the underlying travels far enough to pass its strike price, meaning the more movement the market expects, the more that contract is worth.
Key Options Volatility Terms
| Term | Definition | Impact |
|---|---|---|
| Implied volatility | The movement the market expects. | Rises and falls with demand for options contracts. |
| Realized volatility | The movement that has already happened, measured from past prices. | Provides the benchmark for judging implied volatility. |
| Volatility skew | How implied volatility differs across strike prices. | Shows how volatility is expected to change as price moves. |
| Term structure | How implied volatility differs across expiration dates. | Shows whether market expects movement in the short or long term. |
| VIX | Cboe’s measure of expected 30-day volatility on the S&P 500. | Serves as the headline reading for index volatility. |
Implied vs Realized Volatility
Options volatility is split into two measures that answer different questions. Implied volatility asks what the market expects next, while realized volatility asks what has already happened.
What Is Implied Volatility?
Implied volatility (IV) measures the movement in the price of the underlying based on the options market’s expectations. Brokers, exchanges, and data vendors publish IV for each strike and expiration listed on any options chain.
IV matters because it is a primary factor in the price of any given options contract. When implied volatility changes, the price of an option contract changes accordingly. That is why an option can lose value even when the underlying moves the way the buyer wanted.
Demand is the main driver behind changes in IV. For example, options buyers competing for protection or speculating ahead of an earnings report can push implied volatility up. Once the event passes, IV typically settles back down. Implied volatility can also climb sharply while the underlying barely moves, meaning the expectations of forward price movement has driven the increase in options prices.
What Is Realized Volatility?
Realized volatility (RV) measures price movement that has already happened. To calculate it, traders look at the daily percentage changes over a recent stretch of trading, usually 20 or 60 trading days. Realized volatility measures the spread of those daily changes.
Measuring price movement over a given timeframe captures the typical size of a single day’s move. Scaling this metric to an annual figure then places realized volatility and implied volatility on the same footing.
Reading Implied Volatility versus Realized Volatility
Most of the time, the market expects more movement than actually arrives. Implied volatility today tends to sit above the realized volatility.
Options sellers take on risk risk and charge extra for carrying that risk. Options buyers accept this exchange when they purchase an options contract. The resulting gap is known as the the Variance Risk Premium.
Price shocks can potentially compress the gap between IV and RV, sometimes flipping the relationship entirely. Implied volatility often jumps the moment a selloff starts, while realized volatility climbs only after large daily moves occur.
Afterwards, implied volatility may fall back first, while realized volatility stays relatively elevated until those large range days age out.
Understanding VIX and Expected Daily Moves
The VIX is the Cboe’s measure of the implied volatility that the market expects on the S&P 500 over the next 30 days. Cboe builds it from a wide range of SPX option prices rather than any single contract, which is what makes it a market-wide gauge. Those options sit at and beyond the current spot price, with more than 23 and fewer than 37 days left to a Friday expiration.
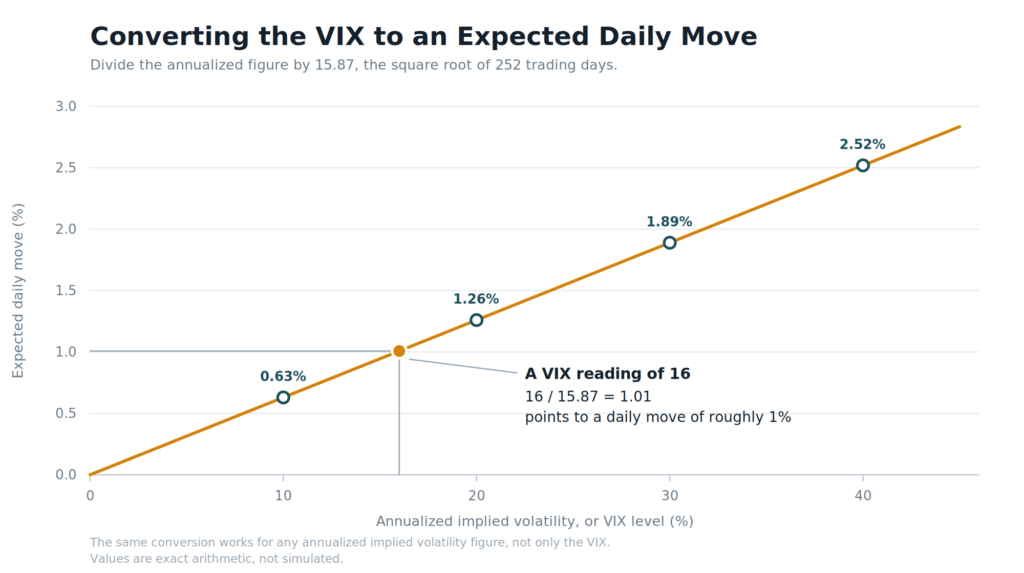
The VIX quotes an annual figure, so traders convert it to a daily one. To do so, divide the current VIX by the square root of the trading days in a year. Because US markets trade 252 days on average, that means dividng by 15.87.
If VIX measures 16, that can be converted to a daily figure by dividing 16 by 15.87 to get 1.01, equating to an expected daily move of roughly 1%.
Volatility Skew and the Volatility Term Structure
When looking at Implied Volatility, each strike and expiration has its own reading. Volatility skew is pattern those readings make across strike prices for a single expiration.
Traders measure skew as the gap in implied volatility between two strikes an equal distance from the current price. This gap is also known as the risk reversal, and the direction (leaning towards calls or puts) gives the skew its name.
What Is Put Skew?
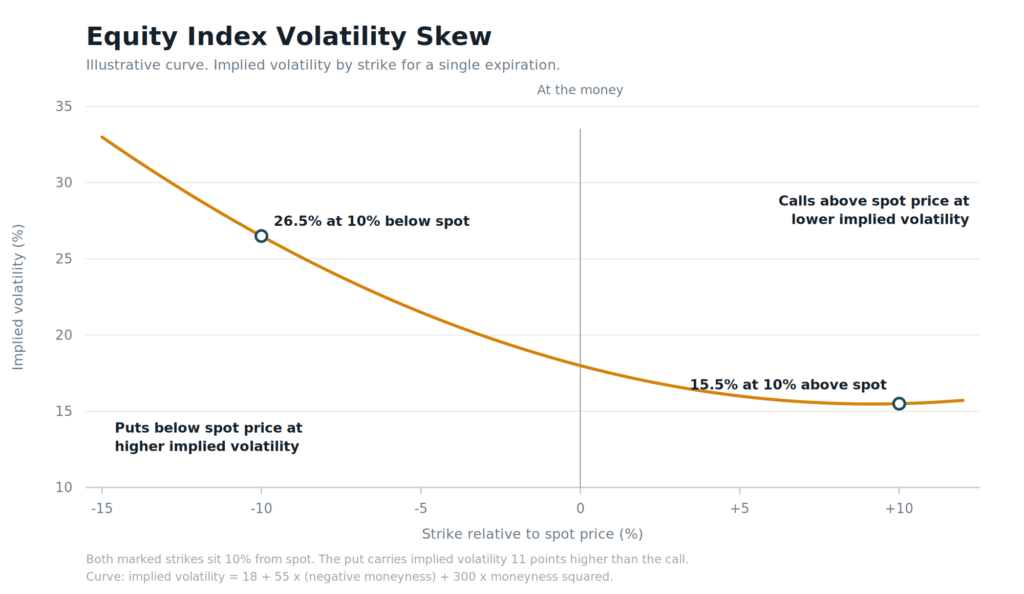
Put skew describes a curve where implied volatility increases for strikes below the current underlying price. Puts below the underlying price then trade at higher implied volatility than calls an equal distance above it.
Equity index options show put skew almost all of the time. Investors who hold stocks buy puts for downside protection of those holdings, so bids for downside strikes can persist. Index selloffs also move faster than rallies, and sellers price that into their quotes.
On the illustrative curve below, at-the-money implied volatility sits at 18%. At-the-money describes the strike closest to the current price. A put 10% below spot prices at 26.5%, while a call the same distance above prices at only 15.5%.
What Is Call Skew?
Call skew describes how implied volatility rises increasingly for strikes above the current spot price. Upside calls then trade at higher implied volatility than puts an equal distance below it.
Single stocks produce call skew ahead of a catalyst such as earnings or a takeover bids. Energy and agricultural markets display the pattern too, because buyers there hedge against supply shocks that push prices up.
What Is the Volatility Term Structure?
Term structure plots implied volatility across expiration dates rather than across strike prices. Where skew answers which strikes carry the most expected movement, term structure answers which expiration dates are of interest to options traders.
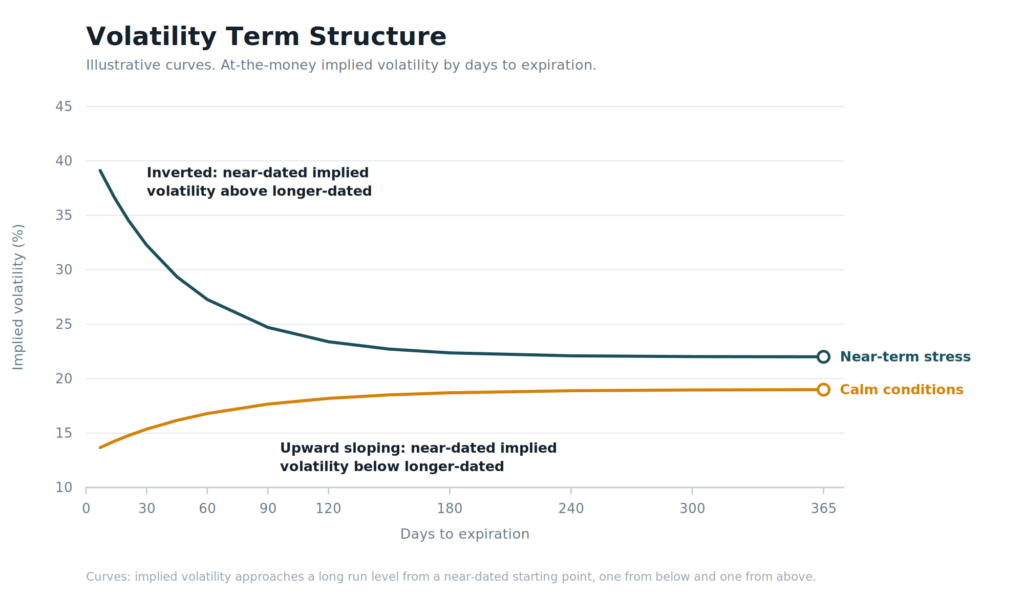
Near-dated options usually price low, because the market expects little to happen soon. Longer-dated options tend to price higher, because more can occur over a longer window.
Contango and Backwardation
Contango and backwardation name the two shapes that curve can take, both terms come from futures markets. Traders apply them to the VIX futures curve and to the implied volatility term structure alike.
Contango describes the upward sloping curve, where longer-dated volatility is above near-dated volatility. Contango usually signals a calmer market.
Backwardation describes the inverted curve, where near-dated volatility prices above longer-dated volatility. It appears when traders bid for immediate protection, and it means the market is signaling that it expects the disruption to pass rather than persist.
How Options Volatility Drives Dealer Positioning
Options volatility does not sit apart from price. Changes in implied volatility alter what options dealers have to hedge, and their hedging trades move the underlying asset.
Implied Volatility Changes What Dealers Hedge
Dealers take the other side of most customer options trades, then buy or sell the underlying to stay directionally neutral. Delta sets the size of that hedge, measuring how much an option’s price moves for each $1 move in the underlying.
Implied volatility feeds into delta, so when implied volatility moves, deltas across a dealer’s book move with it. This measure of sensitivity is called Vanna, and our guide to options dealer hedging breaks down the full mechanism.
Realized Volatility and the Gamma Regime
Gamma measures how fast delta changes as price moves, so aggregate dealer gamma shapes how far price actually travels. Gamma exposure maps where that gamma concentrates across strikes.
When dealers hold positive gamma, they sell into rallies and buy into declines, which compresses realized volatility. When they hold negative gamma, they buy into rallies and sell into declines instead, which expands it.
Realized volatility is therefore highly related to dealer positioning: positive gamma is associated with lower realized volatility, while negative gamma is associated with heightened realized volatility.
SpotGamma Tools for Tracking Options Volatility
Volatility is best viewed as a surface rather than a single figure. Every strike and every expiration carries its own IV, and each of those readings has a history behind it. Trading volatility requires viewing the entire surface, whle also understanding where today’s values sit against that history.
Mapping Options Volatility Across Strikes and Expirations
SpotGamma’s Volatility Dashboard visualizes the volatility surface in one singular window. The Fixed Strike Matrix lays out implied volatility as a grid of strikes against expirations, for more than 3,500 US stocks, ETFs, and indices.
The dashboard is color coded to display cells that are running unusually high or low against its neighbors, these point towards contracts that look expensive or cheap.
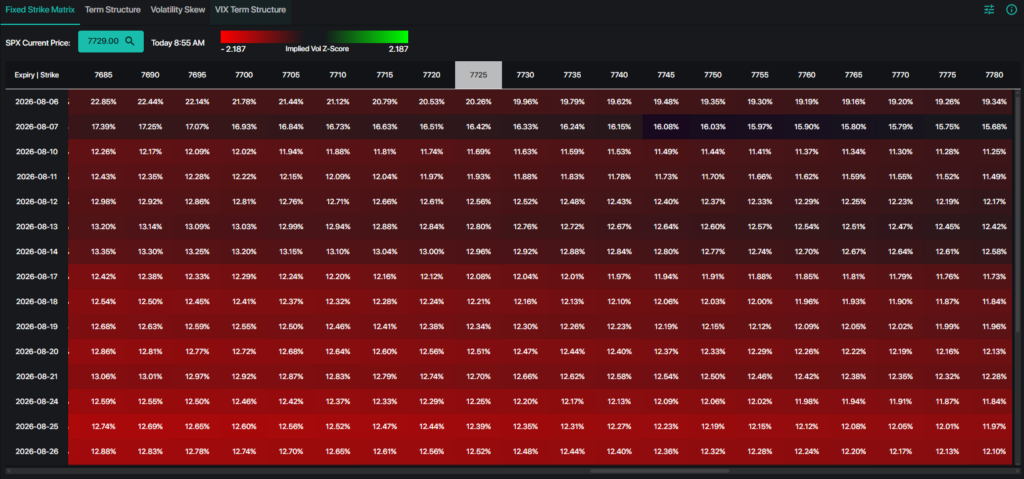
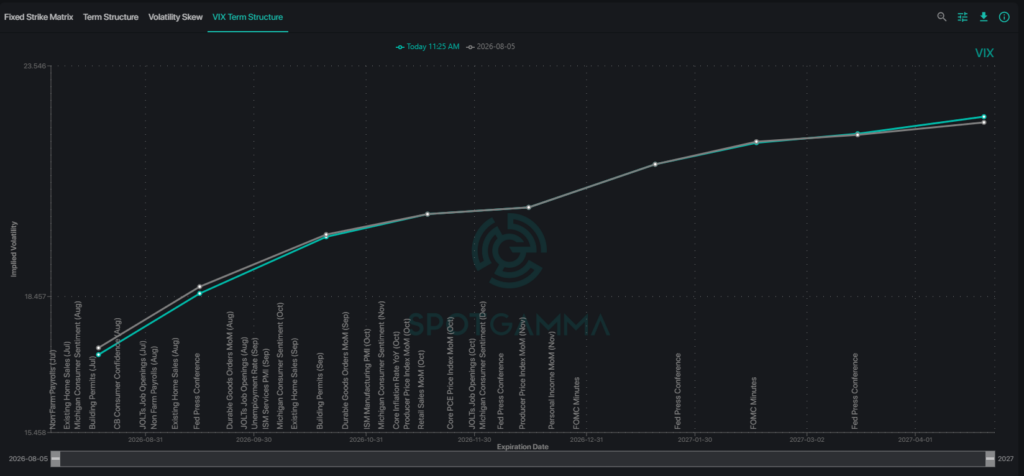
The Dashboard also has separate tabs for displaying Volatility Skew and Term Structure, allowing traders to see the full map of implied volatility. Each tab within the Volatility Dashboard allow for comparisons against historical values.
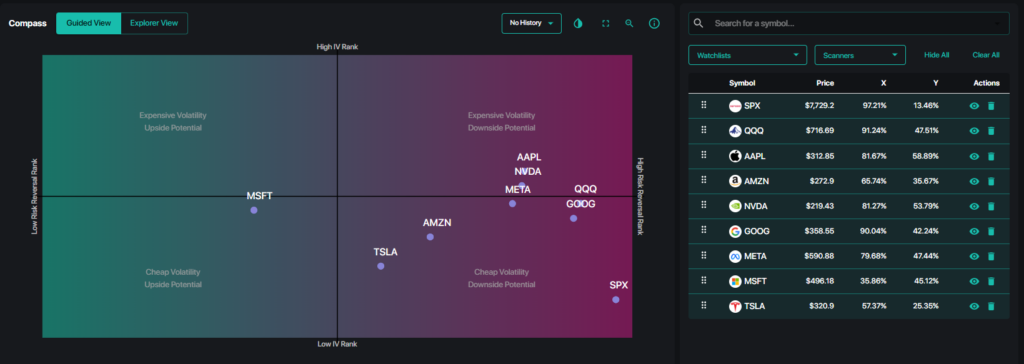
Compass displays both the relative implied volatility and skew across any name added to the chart. The tool dispalys tickers by IV Rank, which sets current implied volatility against the prior year’s range, and by Risk Reversal Rank, based on the current level of skew versus the prior year’s range.
Compass then plots each name on a grid of volatility expectation against directional positioning. Its VRP scanner picks out the names where the gap between implied and realized volatility stands out.
Connecting Options Volatility to Dealer Positioning
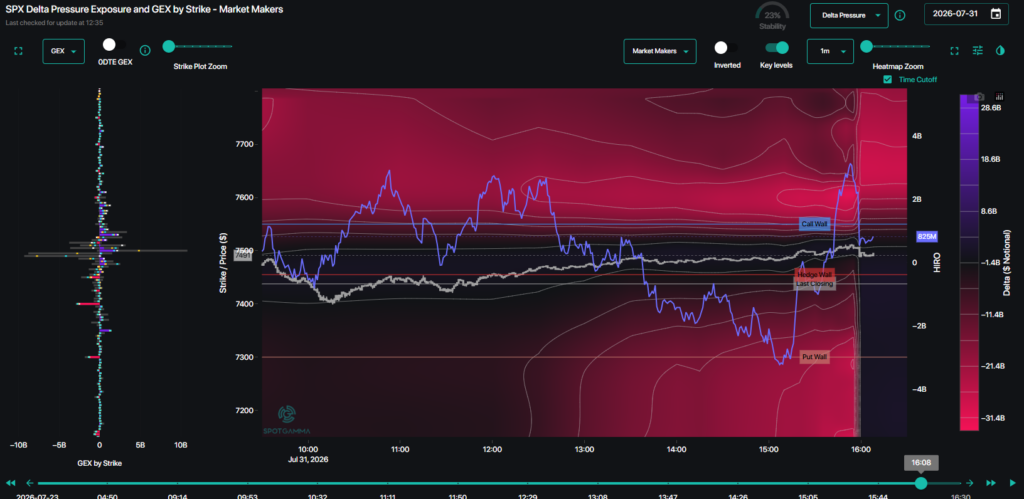
TRACE covers the other side of that trade for the S&P 500. It maps dealer gamma, delta, and charm pressure across every strike and expiration, updating every minute. Those maps show where dealer hedging is likely to compress or expand realized volatility throughout the trading day.
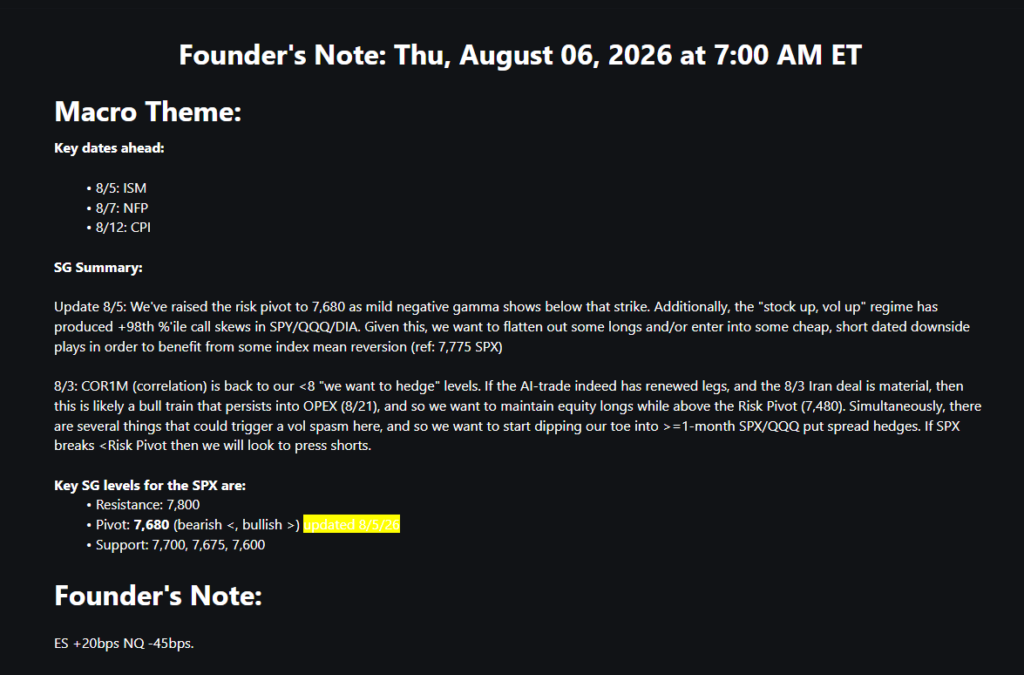
The daily Founder’s Note breaks down both dealer hedging and how that mechanically relates to implied volatility. This analysis is published in SpotGamma’s dashboard each morning and evening, and also outlines where the key levels sit and how the volatility landscape looks for the session ahead.
Subscribe to SpotGamma
Every SpotGamma plan includes the Total OI Model and key levels for 3,500+ US stocks, ETFs, and indices, along with the daily Founder’s Note and live options data via Tape. We also support our community with multiple weekly sessions providing market analysis and education, alongside an engaged Discord community.
Essential Membership
For active traders who want the key dealer-positioning levels and daily market structure briefing.
- Daily Founder’s Note (morning and evening)
- Key Levels: Call Wall, Put Wall, Zero Gamma, Volatility Trigger
- SPX/SPY/QQQ/IWM GEX charts
- Equity Hub: Proprietary daily dealer positioning for +3,500 stocks
- Options Calculator
- Education Library
- Tape: real time options prints in +3,500 stocks
- Multiple live training sessions each week
Alpha Membership (Most Popular)
For intraday, options, and futures traders who need the deepest, real-time dealer positioning data.
- Everything in SpotGamma Essential
- TRACE: Intraday SPX hedging heatmaps updated every 1-minute
- 0DTE strike plot and key levels
- Gamma, Delta & Charm Pressure heatmaps
- Synthetic OI Model: Proprietary positioning for 3,500+ names
- HIRO: Real-time hedging impact for options-driven stocks, ETFs, and indices
- Advanced Volatility Dashboard
Options volatility sets what traders pay, what dealers hedge, and where price finds support and resistance, and SpotGamma is built to show you all three. Trusted by thousands of traders, you can see plans at spotgamma.com/subscribe.
Options Volatility FAQ
What is the difference between implied and realized volatility?
Implied volatility looks forward and comes from current option prices, while realized volatility looks backward and comes from past price changes. Implied volatility usually sits above the realized volatility that follows, so traders watch the gap to judge whether options look expensive.
What does the VIX measure?
The VIX measures the volatility the options market expects on the S&P 500 over the next 30 days. Cboe calculates it from a wide range of SPX option prices. It captures the size of expected movement rather than its direction, and it looks forward rather than recording what already happened.
What does a VIX of 20 mean?
A VIX of 20 means the options market expects the S&P 500 to move at an annualized rate of 20% over the next 30 days. Dividing 20 by 15.87 gives 1.26, which points to a typical daily move near 1.26%.
How do you calculate the expected daily move from implied volatility?
Divide the annualized implied volatility by 15.87, the square root of 252 trading days. An implied volatility of 16% therefore gives roughly a 1% daily move. Cboe annualizes the VIX using calendar time, so treat the conversion as an approximation.
How is implied volatility calculated?
An option pricing model links a contract’s price to inputs such as the strike, the time to expiration, and the price of the underlying. Implied volatility is the movement figure that lines the model up with the traded price. Brokers and data vendors run that calculation and publish the result.
What is put skew?
Put skew describes a curve where implied volatility rises as strike prices fall, so downside puts cost more than equidistant upside calls. Equity index options show this shape almost all of the time.
What is call skew?
Call skew describes a curve where implied volatility rises as strike prices rise, so upside calls cost more than equidistant downside puts. Single stocks show it ahead of earnings or takeover news.
What is contango in the volatility term structure?
Contango describes an upward sloping term structure, where longer-dated options price at higher implied volatility than near-dated options. Calm markets usually sit in contango.
What is backwardation in the volatility term structure?
Backwardation describes an inverted term structure, where near-dated options price at higher implied volatility than longer-dated options. It appears when traders bid for immediate protection during stress.
What is IV crush after earnings?
IV crush describes the drop in implied volatility after a scheduled event resolves. Demand ahead of earnings lifts implied volatility on the expirations that capture the report. Once the company reports, that implied volatility falls, which can cut an option’s value even when the stock moves the buyer’s way.
Does implied volatility predict market direction?
No. Implied volatility measures the size of expected movement rather than its direction. A steep put skew reflects hedging demand, not a forecast that price will fall.