
The current setup feels eerily familiar. In January of ’21 we wrote a note called “When YOLO goes YOL-OH NO!” which outlined the risks embedded in this market. At that time, we viewed market downside risk was high based on:
- Large speculative call positions which increased leverage and market volatility
- Small relative put positions which infer the market is not hedged for a downside move
- Little short selling in markets
What ensued was a very sharp ~4% drawdown… which lasted all of 5 days. However during the ~2 months since that was written we’ve seen two of the largest single day VIX spikes in history.
And since writing that “YOLO” article, the options market has continued this pattern and become more committed to the current call position.
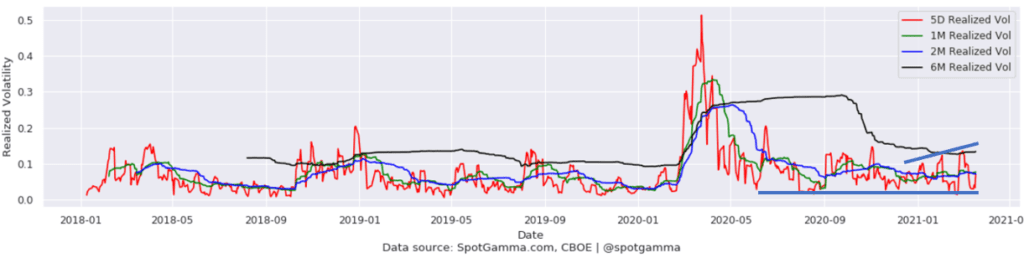
With that we note that realized volatility, how much the market has been moving, has been increasing during each peak this year. You can see this measured in the chart below which depicts realized volatility on a 5 day (red) and 1 moth basis (green). This is a sign of instability, and arguably a signal that the market is illiquid.
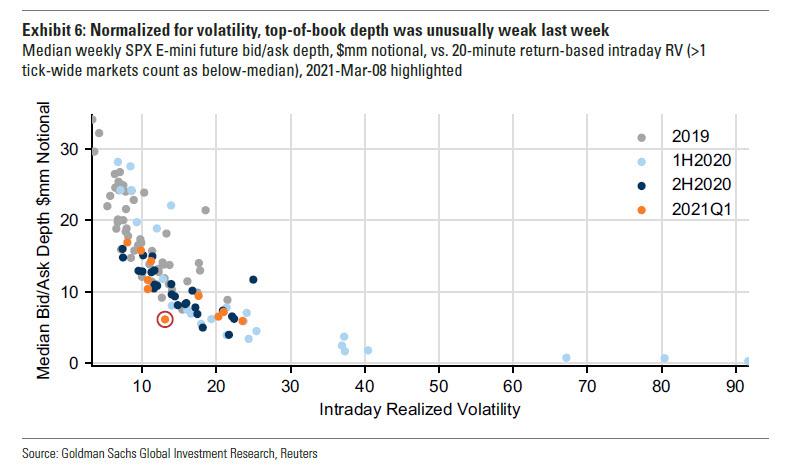
To further illustrate this point, the below graph from Goldman depicts the top of book liquidity in ES (S&P500 emini) futures. You can see that the available liquidity into the second half of ’20 and 1st quarter of ’21 has been diminishing. The issue of course is that when liquidity is poor the a trader must seek larger price intervals to get their order filled. In other words a trade of say 500 futures contracts creates more relative market impact today that it did in 2019.
Despite this high volatility and poor liquidity measurements, selloffs have been violent but contained. Along with this theme of diminishing liquidity we note that the open interest in the S&P500 Index (SPX) contracts is decreasing despite record total options positions.
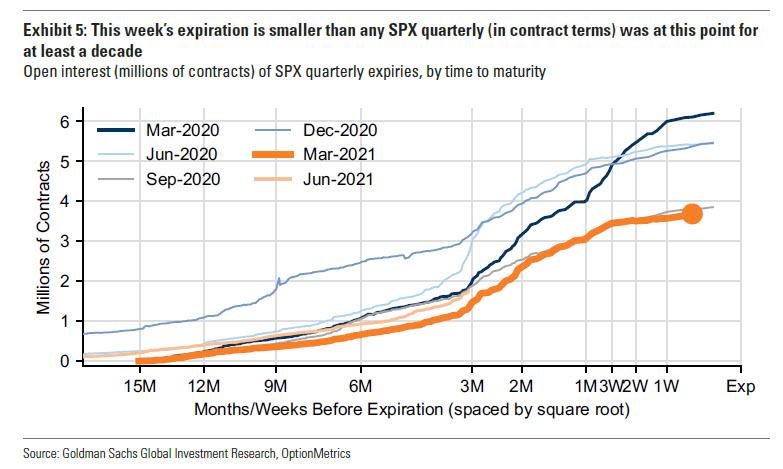
We see the SPX contract as typically being used by large institutions as opposed to retail traders. This is because of the large notional size, and link to VIX and volatility products. This particular true when large funds look for downside protection – historically SPX put options are a primary tool for hedging. The fact that total volumes in the SPX are down suggests either a lack of hedges, or that funds are sourcing protection via other means.
This lack of interest in SPX puts is despite a VIX index that is materially higher following the Covid-crash.
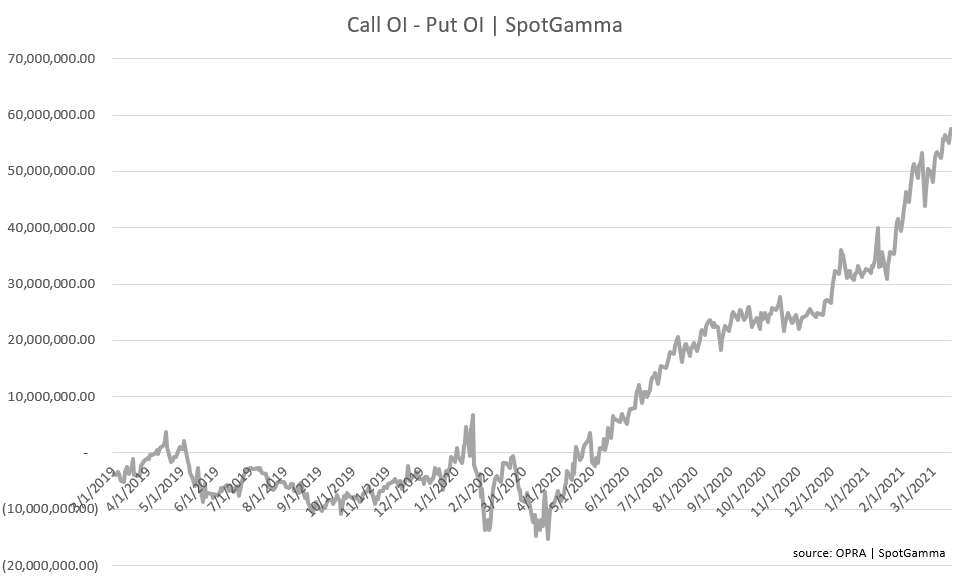
Converse to the lack of interest in puts, trader’s appetite for call options remains unabated. Below we plot the total call open interest for all stocks, against total put open interest. The net call position has increased at an incredible rate since the March Covid-Crash.
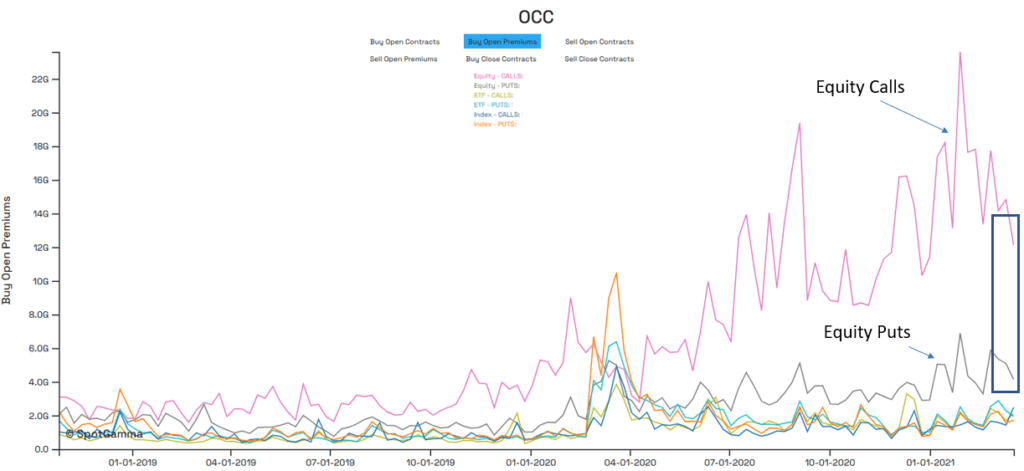
This dynamic is also reflected in the weekly OCC data. Below you can see the net premium spent each week on single stock call buying (pink) vs single stock puts (grey). The market trend has been to spend large and ever increasing amount spent on call premiums.
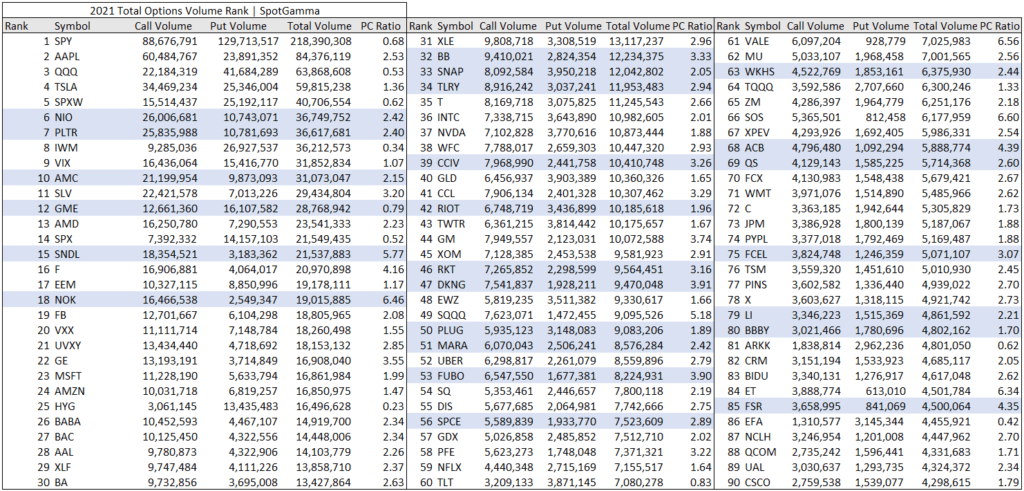
Much of this call activity is focused on the tech sector, and/or very speculative stocks. Highlighted in blue are stocks we’d tag as “meme” names as they are consistently mentioned on retail trading boards such as WallStreetBets.
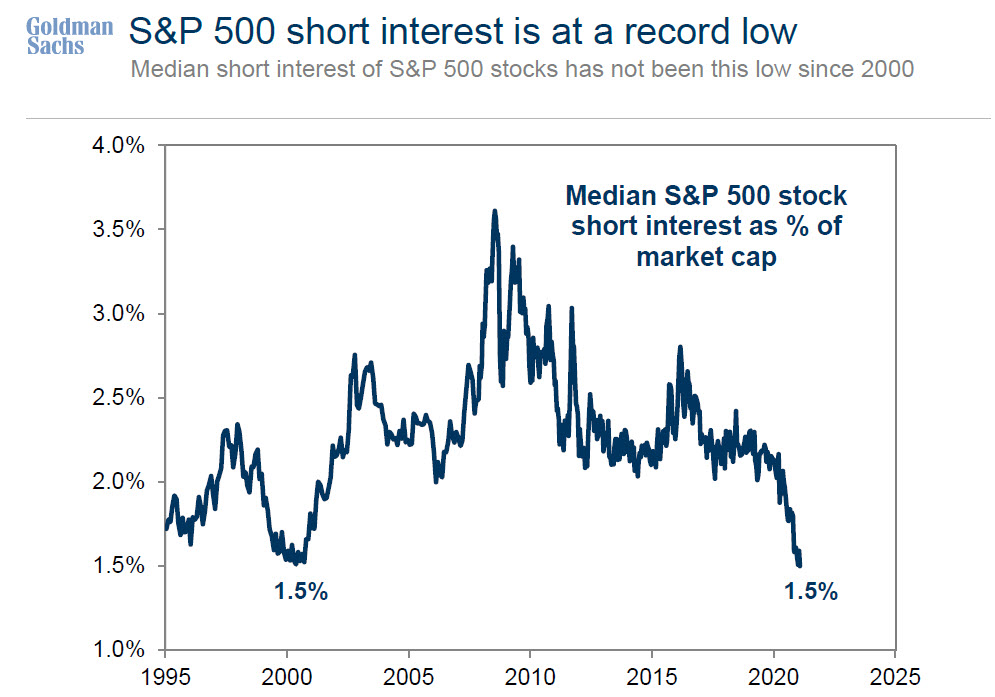
Along with very low put positions, Goldman points out that S&P500 short interest is at lows last seen in the year 2000 (an much lower than our Jan YOLO note).
What we find very interesting at this market juncture is that the QQQ tech sector may have stalled out, arguably as a result of interest rates and/or sector rotations. This is a sign of caution as traders who are spending large sums on tech call options find their premiums erode, resulting in a permanent loss of capital.
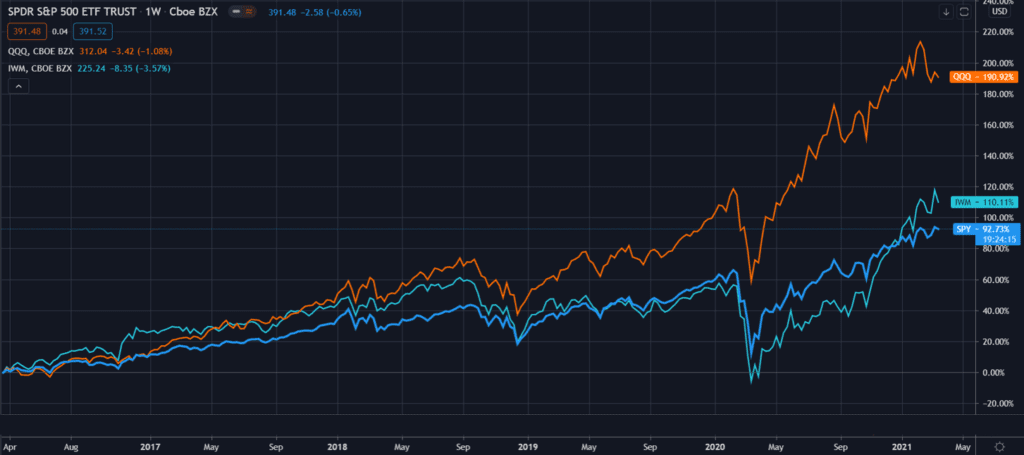
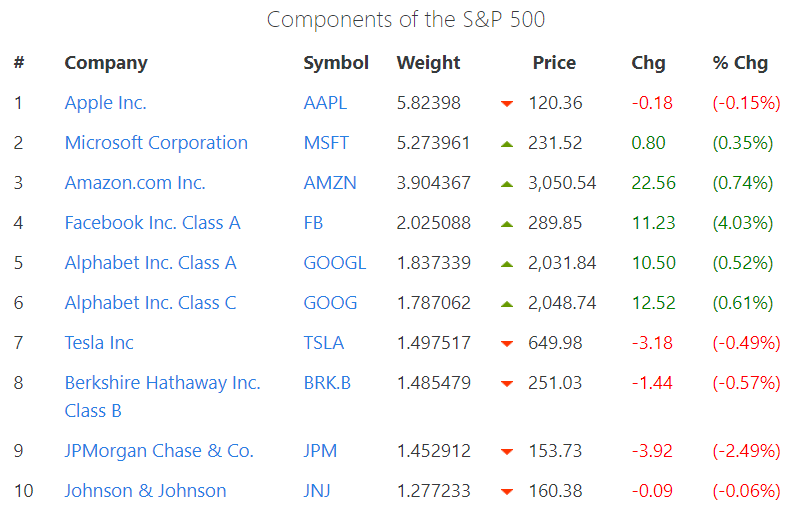
Should the tech heavy Nasdaq/QQQ experience a selloff it would most certainly impact the S&P500. This is the result of the ~7/10 components being in the technology sector.
The issue with this lack of hedging and extreme call positioning is that it invites a great deal of future volatility. If markets start to decline options market makers will being reducing long stock hedges that are in place against those long calls (gamma hedge). Additionally if traders suddenly elect to purchase put positions, this requires an immediate short sell by options dealers (delta hedge).
Therefore options market makers flows would turn starkly negative at a point in time when market liquidity is very poor.
So here we are, once again highlighting the risks imbedded in this market due to excessive leverage, low hedging, no short positions, and a lack of liquidity.
Stuck in Punxsutawney waiting for Spring to come…