Summary:
Issue: SpotGamma believes that current markets reflect a great amount of risk and face the prospect of a violent drawdown. This is due to the following:
- Hedging: Low levels of options-based hedging.
- Short-Selling: Low levels of stock shorting.
- Speculation: High levels of margin used to buy stocks.
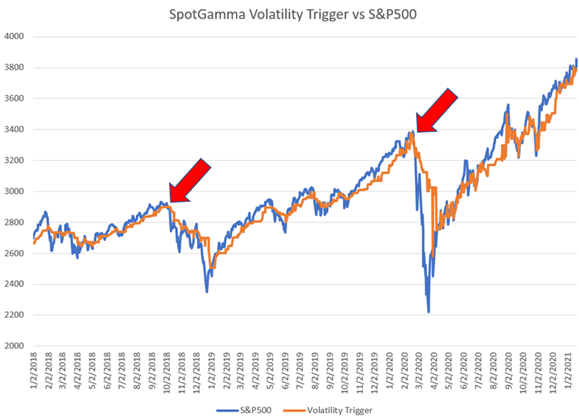
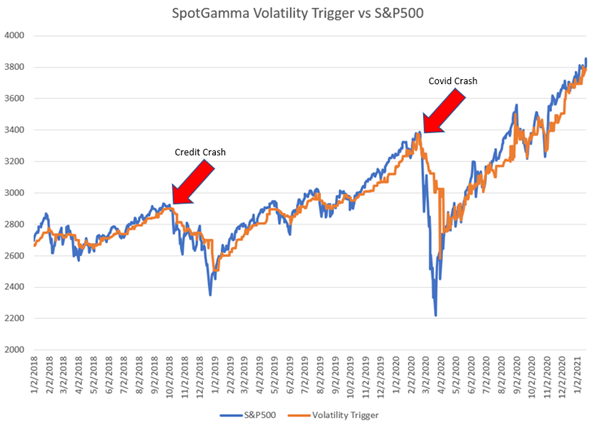
Remedies: SpotGamma levels continue to be reliable during short intervals and periods of dramatic drawdowns. While our Call Wall (resistance) and Key Gamma Strike (support) have held over the past months… the SpotGamma Vol Trigger has historically been a warning sign of trouble ahead.
Explanation:
1. Exposure: Low levels of options-based hedging
When investors purchase put contracts, their goal is to make money when stocks decline. This will drive outright returns or provide a hedge against their long investments.
When an investor makes this put purchase as the buyer, often times the seller is a market maker. The market maker then, in turn, is required to short shares of the underlying stock to hedge their risk. In normal healthy markets, the buying and selling pressures find an equilibrium.
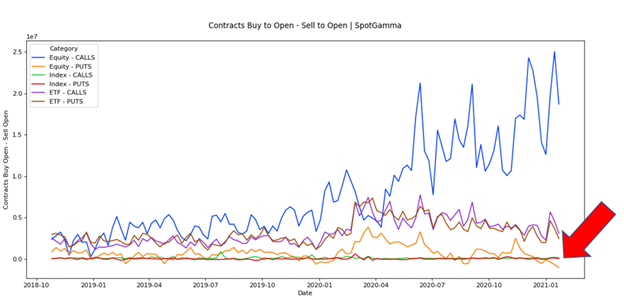
Today, that is not the case, and the market is in a much more precarious situation. The chart below shows the difference between options bought to open against options sold to open. The orange line drops below zero, meaning that a record number of puts are being sold to open, as indicated by the red arrow. If we have a downturn, this setup creates additional selling pressure. This selling pressure can increase the speed of market selling, and forces implied volatility levels higher. As a result puts become more expensive and require more short hedges (see “gamma trap” & vanna ).
As this decline begins, there are two additional drivers of downward pressure which create a snowball effect. First, market makers who are net long put options against stock must sell their stock into the weakness as the market declines. Second, market makers who are short calls, due to the extreme level of call buying (seen in blue), sell the stock they bought as hedges, placing further pressure on the market.
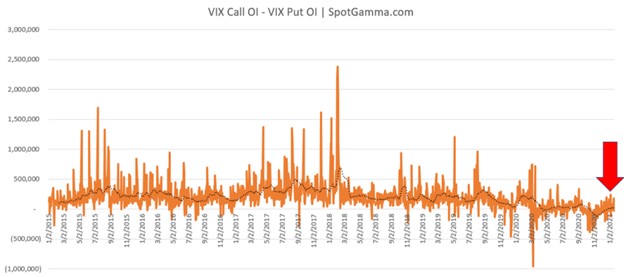
Additionally, it is worthwhile to look at VIX Index, which is often referred to as the “fear index”. The VIX tends to rise as stocks fall, and therefore VIX call options are often used by investors as a way to hedge portfolios against a market crash. Below you can see that current VIX put open interest against call open interest is lower than at any point since 2015. There are much larger bets that the stock market increases and the VIX (aka implied volatility) declines, than there are bets that the market crashes and VIX rises.
2. Short Selling: Low levels of stock shorting
We turn to short selling interest, which is also at lows not seen in several years. This implies that market participants do not think the market will go lower. The prevailing belief is that short sellers help balance markets and regulate speculative buying.
The level of short interest matches lows not seen since 2017:
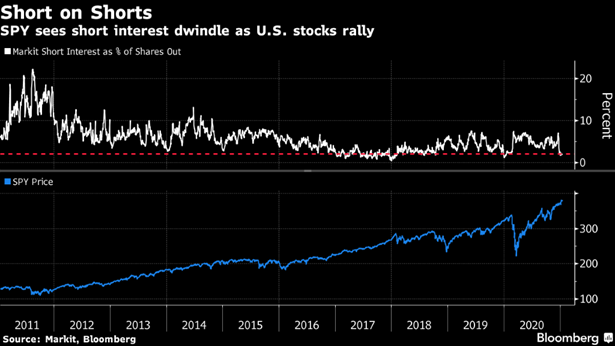
As we discussed earlier, put owners will sell their put positions for a profit when the market declines which incents market makers to cover hedges. Similarly, short sellers will buy back stocks after a sharp decline. This buying to cover of short stock can help buoy weak markets.
Additionally, there is a new and unique dynamic where some stocks have been surging due to coordinated buying and rampant speculation. Two examples are GameStop (GME) and Blackberry (BB). This has cost short sellers billions and may limit short sellers from taking positions out of fear of getting squeezed.
3. Speculation: High levels of margin used to buy stocks
Periods of speculation are often characterized by having significant increases in exposure. Currently, the markets are experiencing large increases in leverage and higher margin use as investors extend more risk and place more bets. According to the chart below posted by Bloomberg, hedge funds prime brokered by Goldman Sachs have raised their leverage at the fastest rate since 2016.
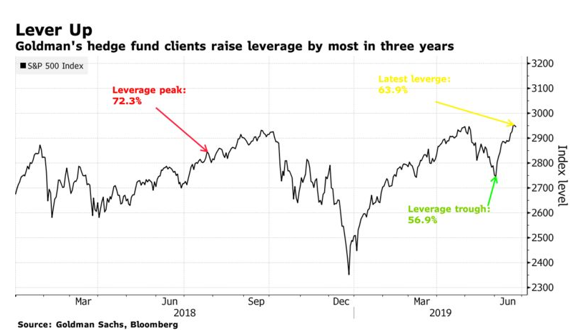
Another good indicator of extreme leverage is the surge in borrowing debt:
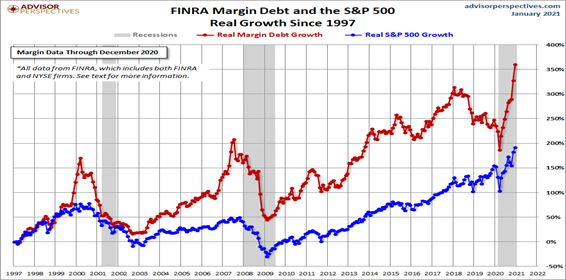
When this happens, if traders are wrong about either their direction or their timing they can get a margin call. Margin calls are when the bank who has provided an investor with leverage requires them to close their position due to high losses. If you are using leverage to buy stocks, when the position starts to go against these investors (decline), this can create significant downward pressure on stocks and the broader market.
Risk:
Trying to time a market break is often a fool’s errand. Imbalances and speculation can last for much longer than most think, and it often takes an unforeseen catalyst to spark the unwind and bring balance back to markets.
At SpotGamma, we believe the most efficient “crash warning” is derived through options data.
Our Volatility Trigger level measures options dealer hedging requirements in an effort to estimate the level at which options dealers selling becomes impactful.
If the S&P500 breaks below the Volatility Trigger level it indicates that options dealers may need to start selling stocks/futures to hedge their portfolios. This could be a “trigger” for “volatility”, as opposed to benign market selling.