There are several major events colliding in mid September, with 9/13 CPI printing in-line with traders expectations. We now turn to 9/15 OPEX is quite large.
Triple Witching OPEX
Sep OPEX times with several major events:
- 9/13 CPI
- 9/15 OPEX
- 9/15 S&P500 Index rebalance
- 9/15 SPY Dividend
- 9/20 VIX Expiration
- 9/20 FOMC
- 9/29 Quarterly Expiration
Our view is that Septemers large expiration has suppressed volatility for the last several weeks, as seen in the dwindling SPX realized volatility, shown below.
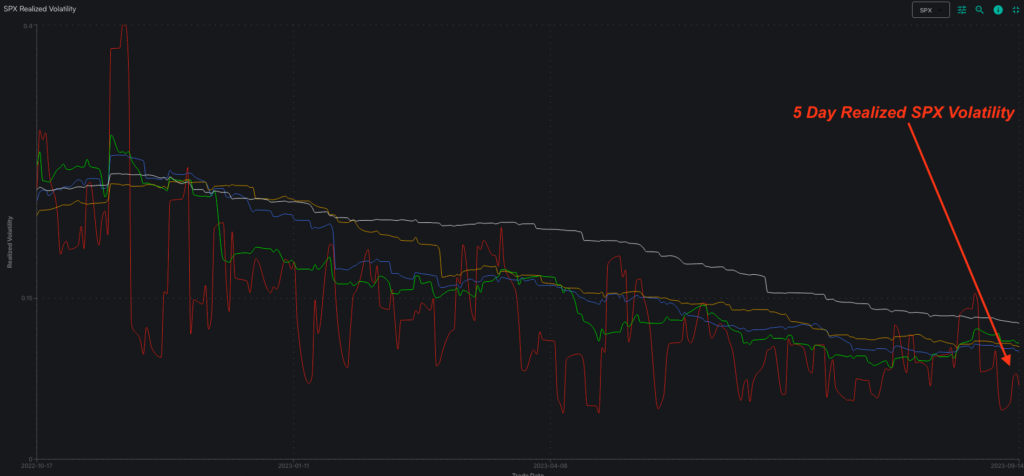
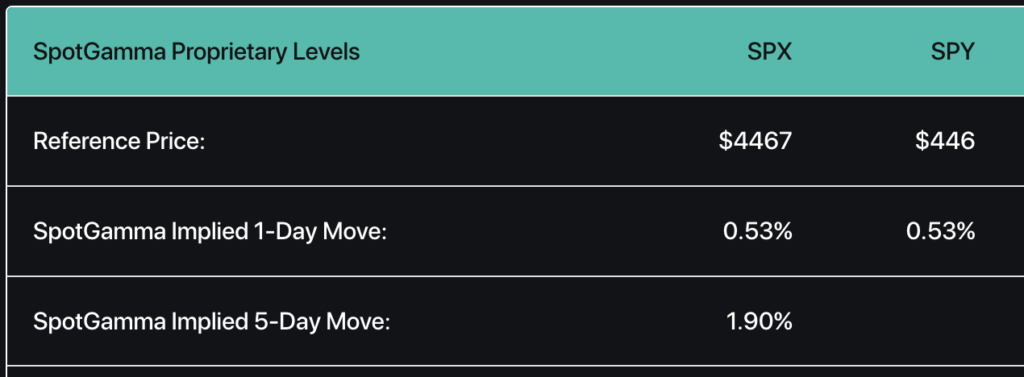
These narrow trading ranges have also been forecasted in SpotGamma’s SPX Implied 1-Day Move, which is featured in our Daily Founder’s Notes. For example, our daily range estimate has been <=0.65% each day for the past week, and was just 0.53% for Thursday, 9/14 (shown below).
This figure is our estimate of the open to close range for SPX on the day, and is derived from options positions. When positions change (as with this large OPEX), it may change the amount of volatility we forecast – an we anticipate an increase for next week.
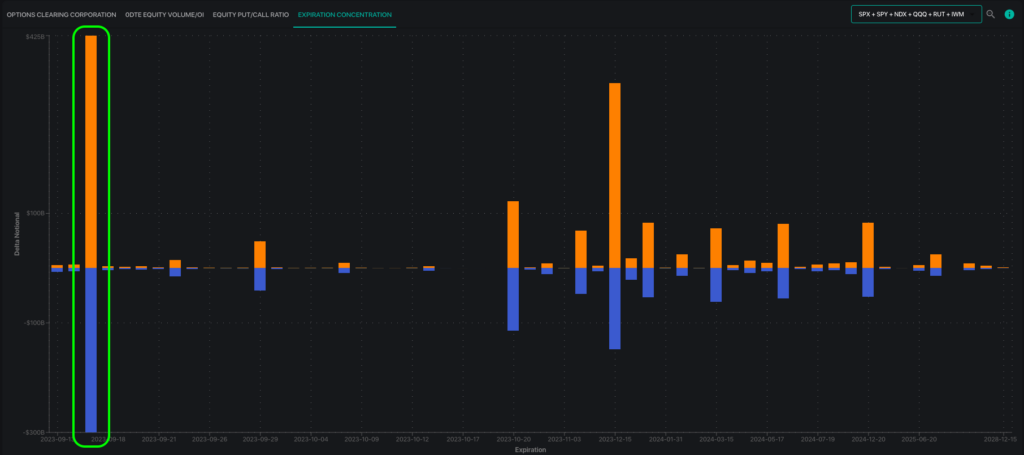
While this expiration is large, it is also very neutral, as shown in the plot below by call delta (orange) being the same delta notional size as puts (blue) across all major indices. We usually look for mean reversion after OPEX, driven by an imbalance of positions. If there is a large build up of calls/puts, we look for market weakness/strength the following weak.
Here, we don’t seem to have an imbalance which removes a directional edge to our forecast.
While there may not be a directional edge, this is an interesting inflection point for volatility as our volatility estimates start differing from the streets options-implied views.
For example, next weeks ATM SPX options have a 10% IV for Fed Day (9/20) and an 11.6% IV for 2 months out. This equates to traders anticipating ~0.65% daily moves in the S&P500. Its likely traders continue these tight volatility estimates, while our 1-Day Implied Move, currently 0.53%, starts to shift towards 1%.
No only may volatility increase due to the removal of options open interest (for both equity OPEX & VIX OPEX), we are also heading into the directional triggers of the FOMC, and some big end-of-month SPX magnet positions (JPM Collar positions of 4660 & 4200).
Further, if the S&P does move more than 0.65% in a single session, you could end up with a volatility pop as traders have cover short volatility positions. This works in a market slide lower, but could also work to the upside (i.e. VIX up, market up).
Take as example May 1, wherein the VIX hit fresh lows & SPX fresh highs. There was then a sudden spike in volatility that resulted in the VIX testing 20, with the SPX down 2.5% (this is when the debt ceiling was being flagged as the cause for concern, into an FOMC).
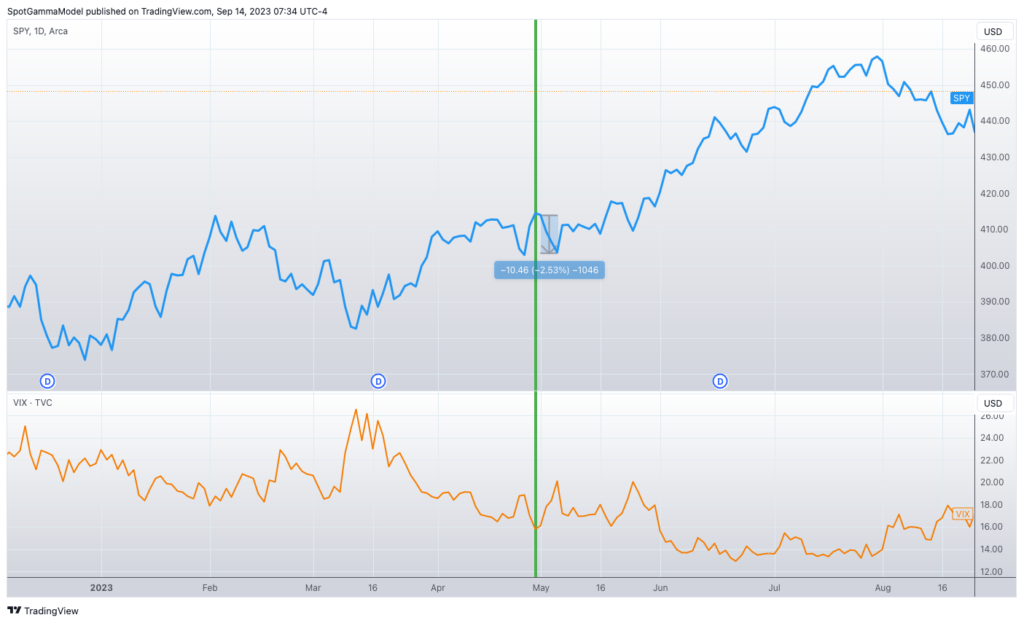
We did a video on this concept back in May, which you can find here.
To be clear, this does not mean we forecast that the VIX has to hit 30 with the S&P dropping 10% in the next 1-2 weeks. It does however suggest that, into the end of September, market moves could be more jumpy than most anticipate.
The Full List of Expiration Names
SpotGamma has compiled an expiration spreadsheet, just enter your email here 👇🏻: