• Skip to main content
  • Skip to primary sidebar

SpotGamma™

S&P 500 Stock Market Gamma Trading Levels Based on Options Open Interest

  • About
  • Pricing
  • Academy
  • Resources
    • Tool Demos
    • Case Studies
    • Blog
    • Support Center
    • Free Daily Report
    • Free Trading Tools
      • Options Profit Calculator
      • SPX Gamma Exposure
      • Implied Earnings Moves
      • Volatility Ranking
    • Free Training
    • Report Card
  • Login

May 16 2022

Introducing SIV: The SpotGamma Implied Volatility Index 

A better way to estimate volatility through a Gamma Lens

Here at SpotGamma, our extensive research and testing has led us to develop an improved method for forecasting market volatility. Our new proprietary model, called the SpotGamma Implied Volatility (SIV) Index, is based on our analytics around S&P 500 Gamma activity and related-movements in the underlying S&P 500.
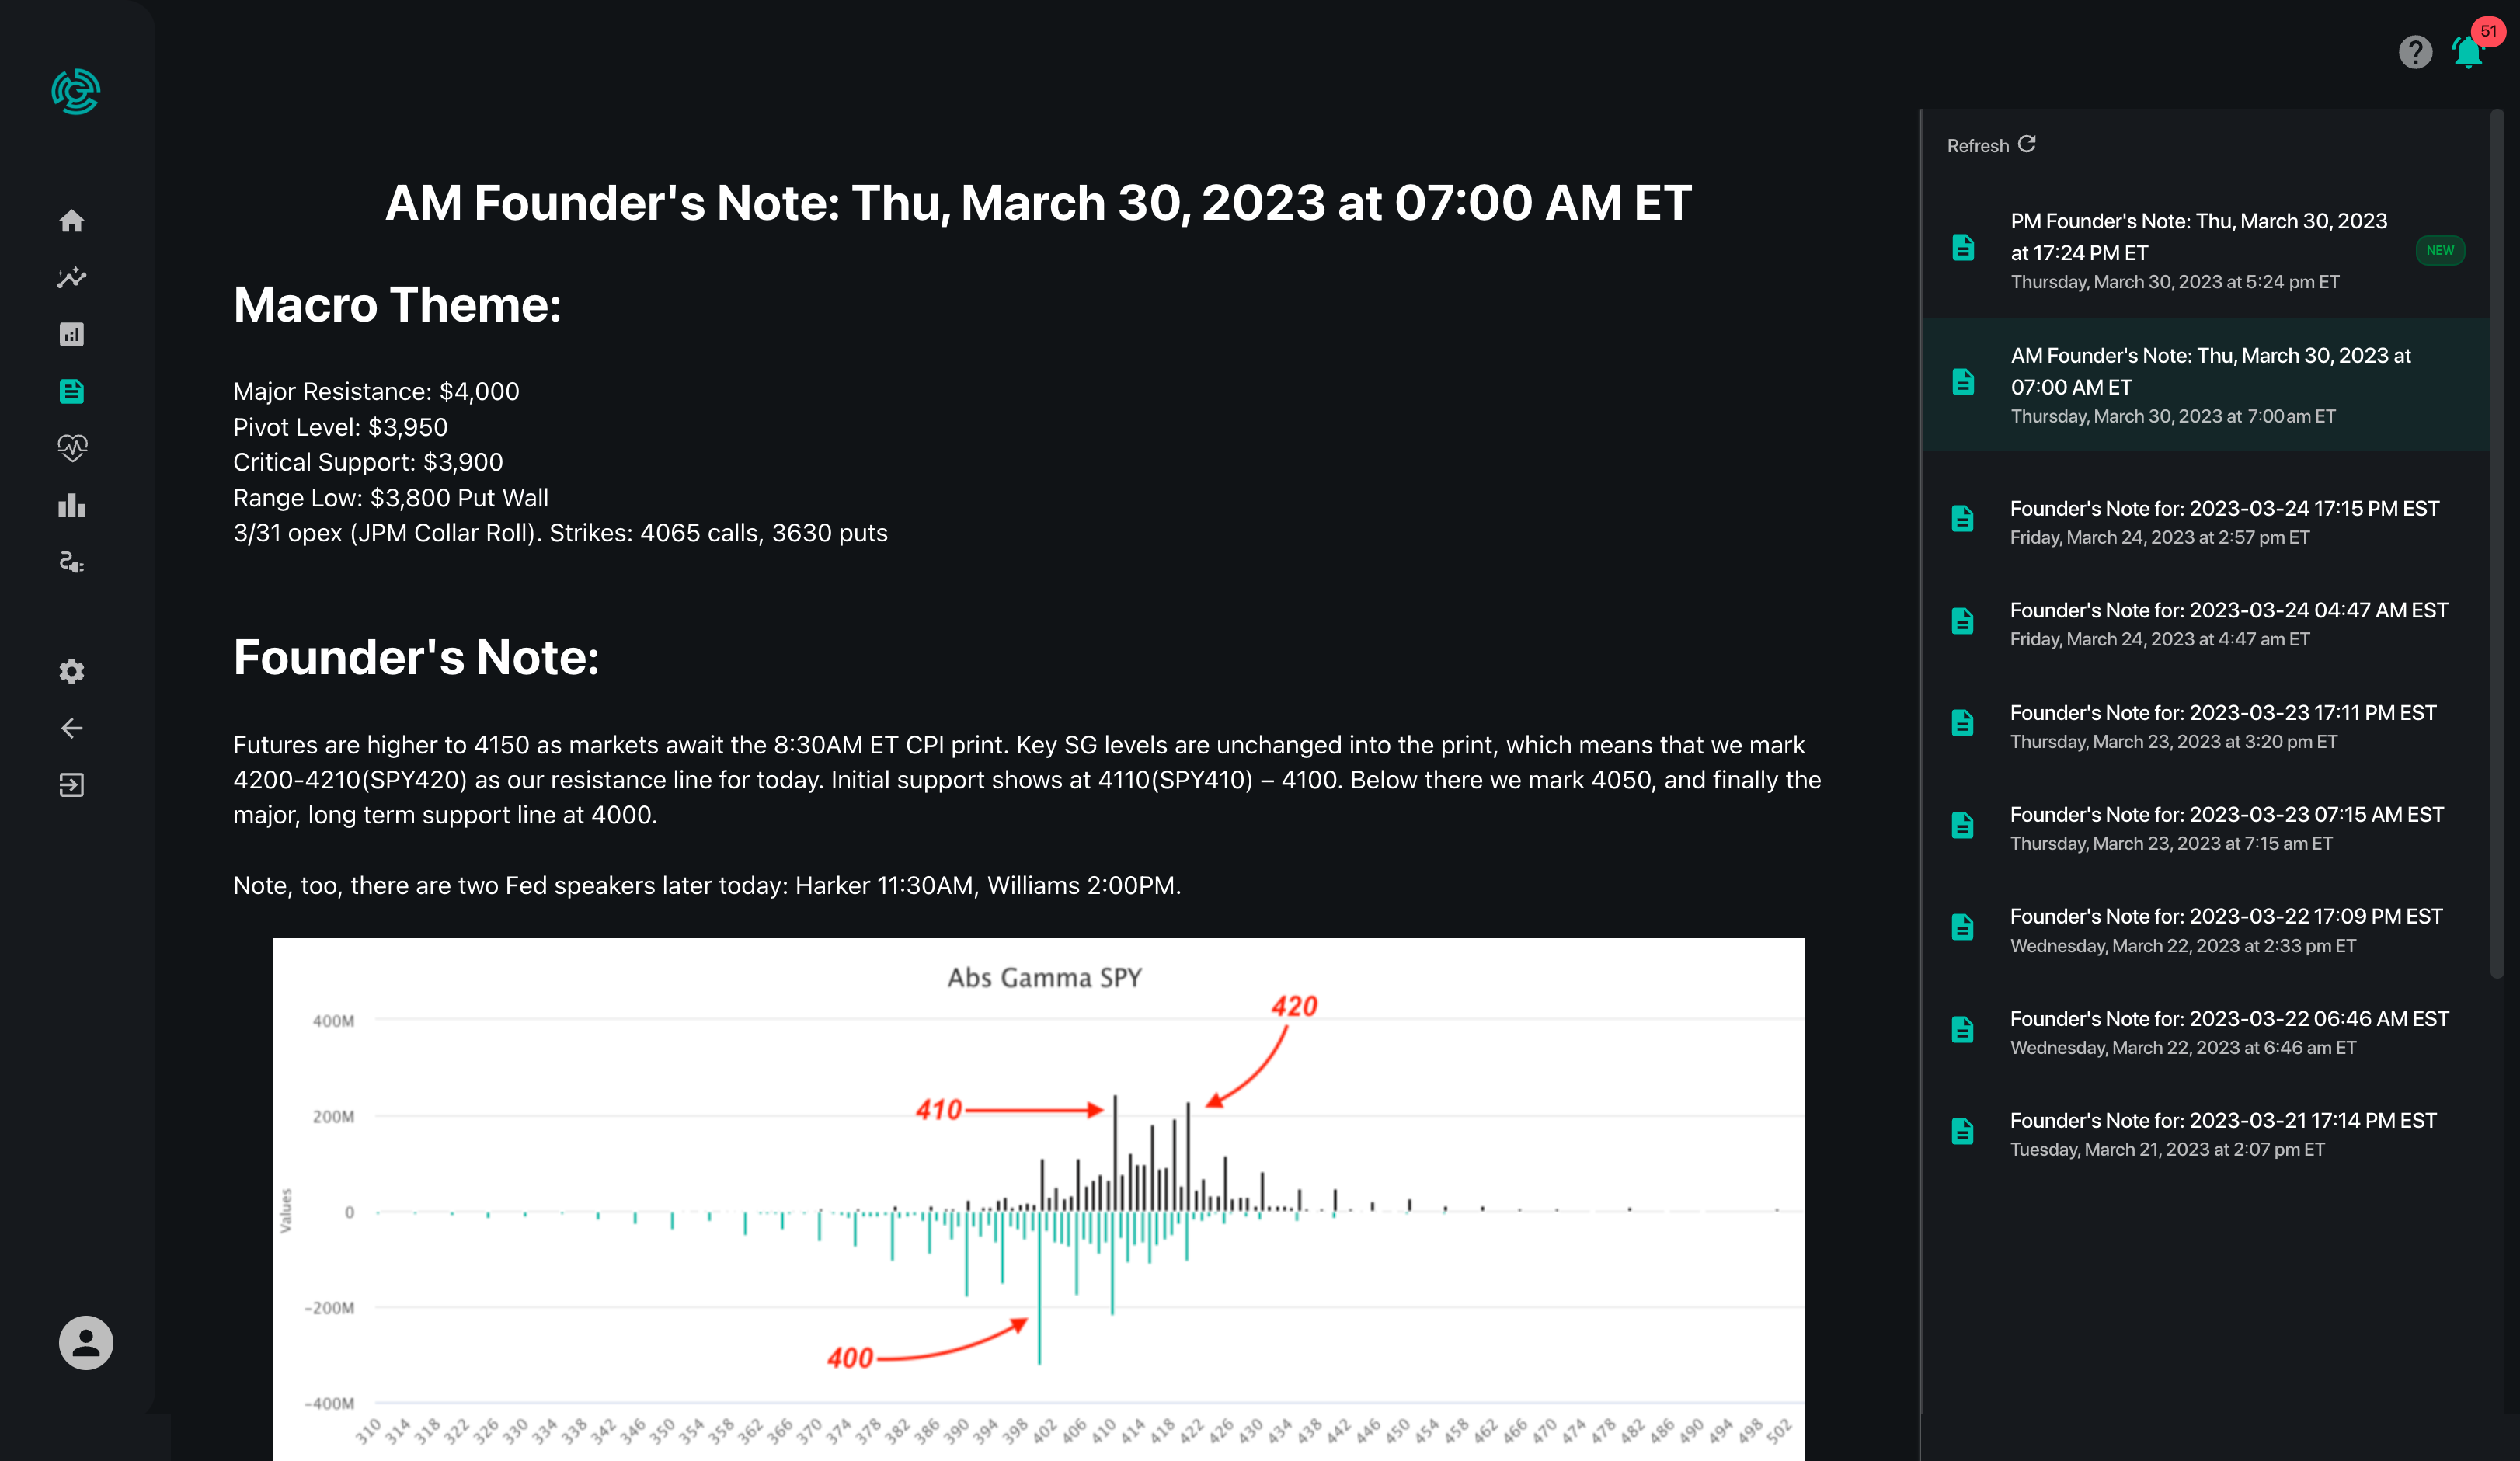

Modern-Founder's-Note-Mockup

We believe basic Gamma Models need to be improved. Our research team has found a more accurate method to forecast market volatility by adjusting our Gamma models. This model unwinds many of the base assumptions made in those ubiquitous Net Gamma models, resulting in a much clearer picture, as seen below. The resulting correlation of r=82 suggests this new Gamma-derived volatility model is a significant improvement for S&P 500 volatility forecasts. 

While we will continue to provide simple Gamma charts, they have limitations to how actionable they are without being evaluated within the scope of other market dynamics or combined with other tools.

Correlation of r=60 vs. r=82

Naive Gamma
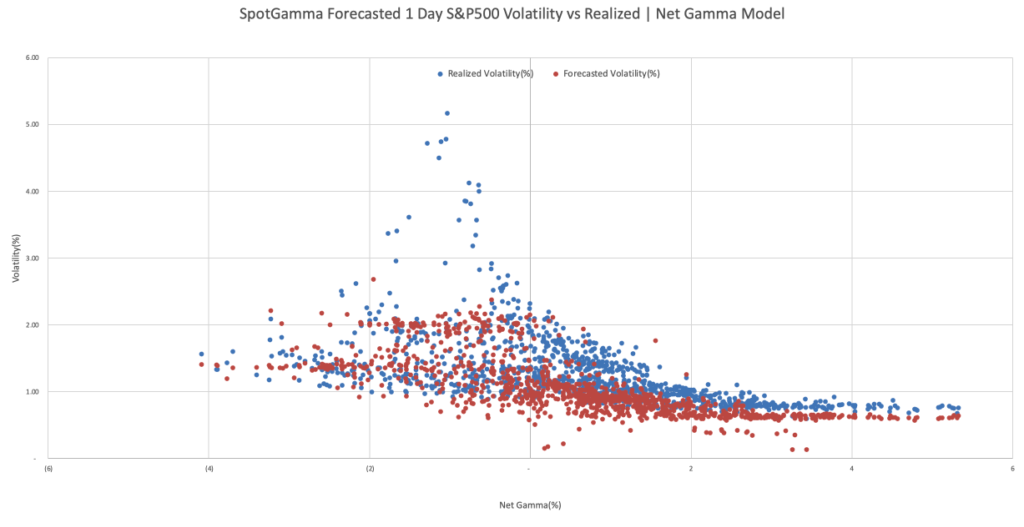
Naive: The correlation of Gamma-derived volatility and realized volatility here is r=60.

SpotGamma Implied Volatility (SIV) Index
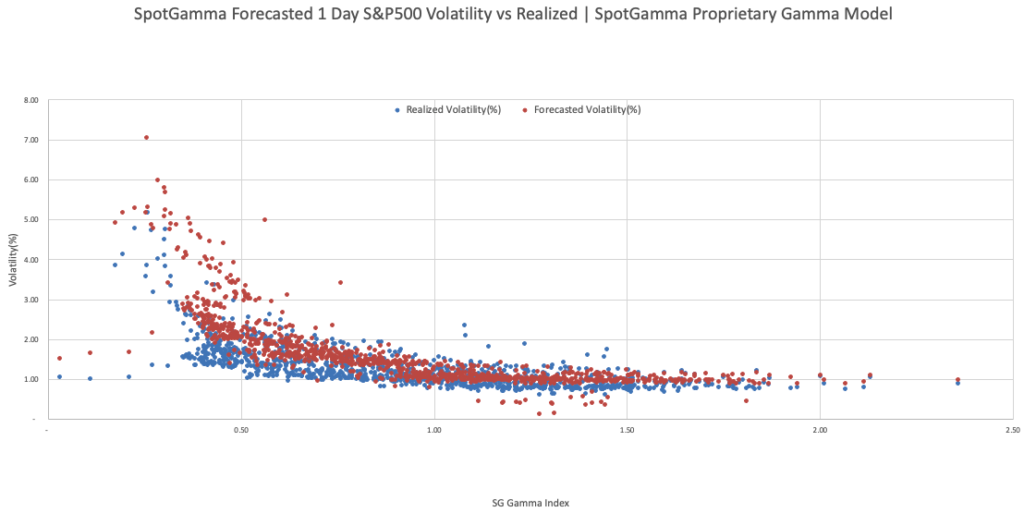
SIV: The correlation of Gamma-derived volatility and realized volatility here is r=82.

Now, the SpotGamma Implied Volatility (SIV) Index moves past the basic assumptions. We have applied proprietary methods that incorporate how the gamma implied volatility may change as the S&P price changes. This will result in more efficient market forecasts, improved volatility estimates, and highly-actionable trading intelligence.

Naive Gamma Chart
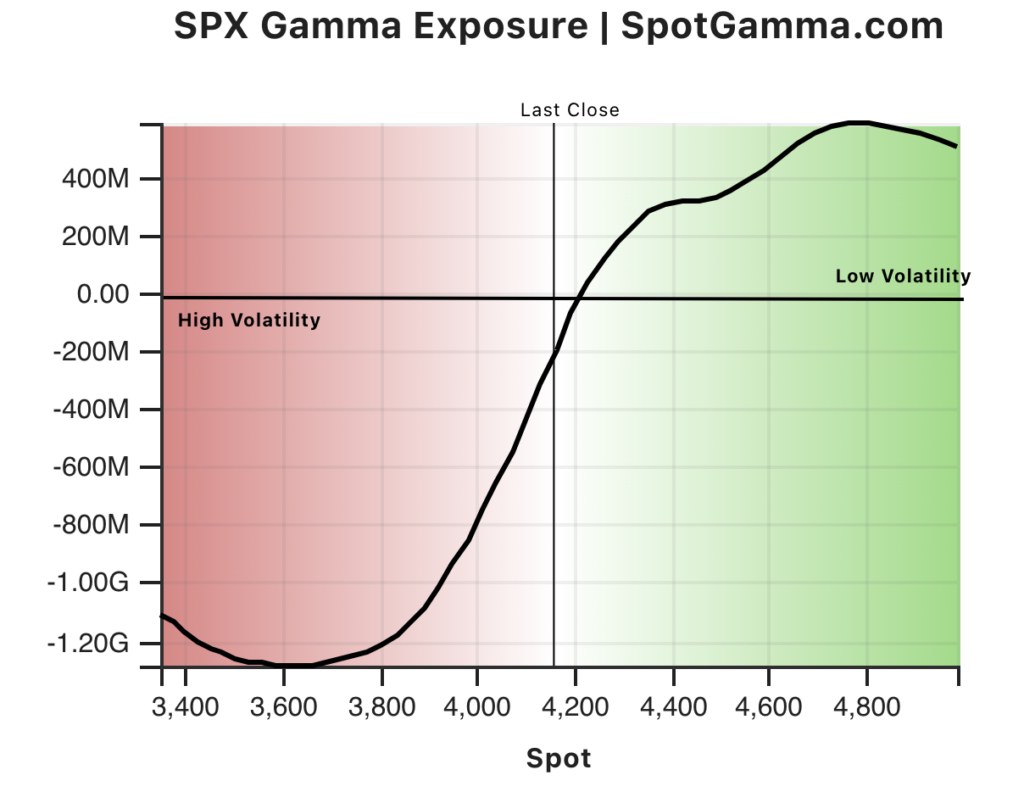
SpotGamma SPX Gamma Exposure Chart

SpotGamma Implied Volatility (SIV) Index Chart
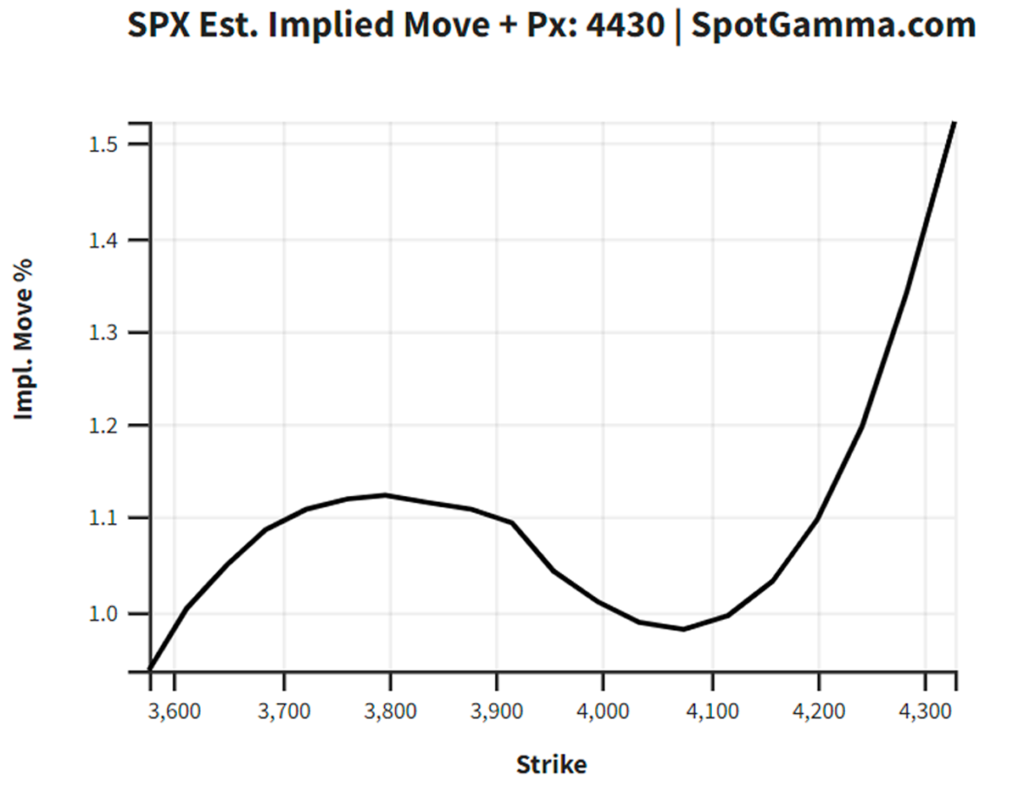
The SIV analysis is only available to paying subscribers. To continue to meet our mission of educating and empowering all investors, we will provide a simplified graphical representation of the naïve gamma curve free to all who may want to use it.

Share This Article

  • Share
  • Twitter
  • LinkedIn
  • Reddit
  • Facebook

Written by SpotGamma · Categorized: Market Analysis

Don’t have an account with SpotGamma?

Choose the plan you want today to view unique support and resistance levels, access Founder’s Notes and expert commentary, daily trading ranges, and entrance into our private Discord.


Primary Sidebar

Related Resources

  • NVDA Earnings: The Options Market May Be Underpricing This Move

    NVDA Earnings: The Options Market May Be Underpricing This Move

    August 25, 2026
  • Volatility Has Compressed. What Happens Next?

    Volatility Has Compressed. What Happens Next?

    August 23, 2026
  • Another SpaceX Unlock, and Why $150 Still Caps the Stock

    Another SpaceX Unlock, and Why $150 Still Caps the Stock

    August 20, 2026
  • Options Exchange Monitor — Week of August 15, 2026 (36 SEC notices, 2 CFTC, 0 EDGAR)

    Options Exchange Monitor — Week of August 15, 2026 (36 SEC notices, 2 CFTC, 0 EDGAR)

    August 17, 2026
  • GEX Levels for SPY, QQQ, ES and NQ: Using Index Gamma in Any Product

    GEX Levels for SPY, QQQ, ES and NQ: Using Index Gamma in Any Product

    August 17, 2026
  • youtube
  • x
  • Privacy Policy
  • Disclaimer
  • Terms & Conditions
  • Support Center
  • Media
  • Contact Us

©2026 TenTen Capital LLC DBA SpotGamma

All SpotGamma materials, information, and presentations are for educational purposes only and should not be considered specific investment advice nor recommendations. Futures, foreign currency and options trading contains substantial risk and is not for every investor. An investor could potentially lose all or more than the initial investment. Risk capital is money that can be lost without jeopardizing one's financial security or lifestyle. Only risk capital should be used for trading and only those with sufficient risk capital should consider trading. Past performance is not necessarily indicative of future results. Testimonials appearing on this website may not be representative of other clients or customers and is not a guarantee of future performance or success.

View Full Risk Disclosure