• Skip to main content
  • Skip to primary sidebar

SpotGamma™

S&P 500 Stock Market Gamma Trading Levels Based on Options Open Interest

  • About
  • Pricing
  • Academy
  • Resources
    • Tool Demos
    • Case Studies
    • Blog
    • Support Center
    • Free Daily Report
    • Free Trading Tools
      • Options Profit Calculator
      • SPX Gamma Exposure
      • Implied Earnings Moves
      • Volatility Ranking
    • Free Training
    • Report Card
  • Login

Feb 10 2020

Gamma Model Positioning Adjustments

Following a LinkedIn blog(?) by a Deutsche Bank fellow who took issue with market gamma models, I decided to run a few quick simulations to look at model error. Many gamma models assume all calls are sold to dealers and all puts are bought from dealers. Certainly this cannot be 100% true, but the back data which uses these assumptions is statistically compelling . The blogger does not address any actual data produced via gamma modeling – for instance the chart below showing the 1 day SPX price distribution for positive vs negative gamma. (Note this data comes out pre-open).
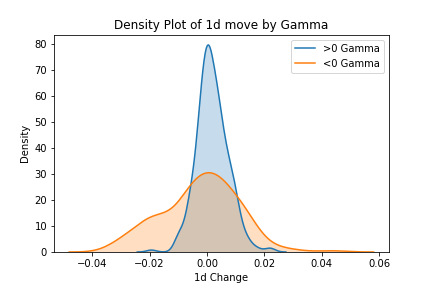
price distribution for positive and negative gamma
SPX Gamma Price Distribution 2018-2020

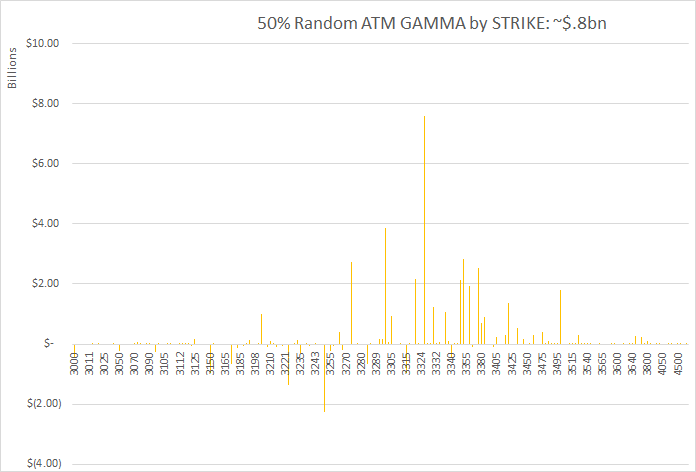
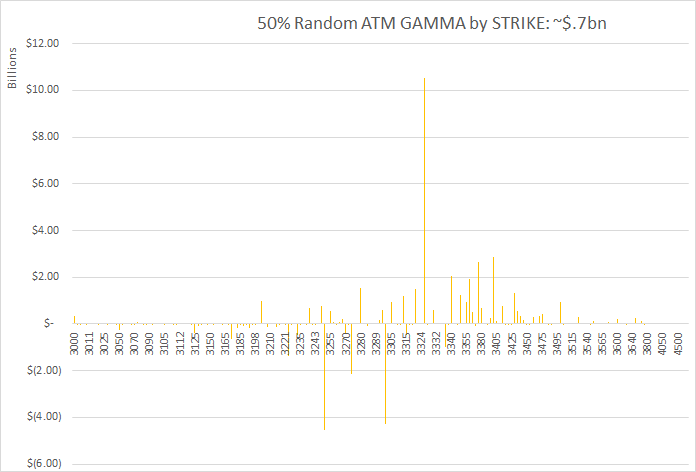
Using the most recent gamma data available (2/7/20) I used excel to visualize how different the gamma distribution may look if we assume that the model is only 50% correct – and the remaining 50% open interest is randomized to be long or short. Just below is our models “normal” chart, with three “random” graphs below that. You can see with those three “random” charts how much the gamma profile can change with a 50% adjustment.
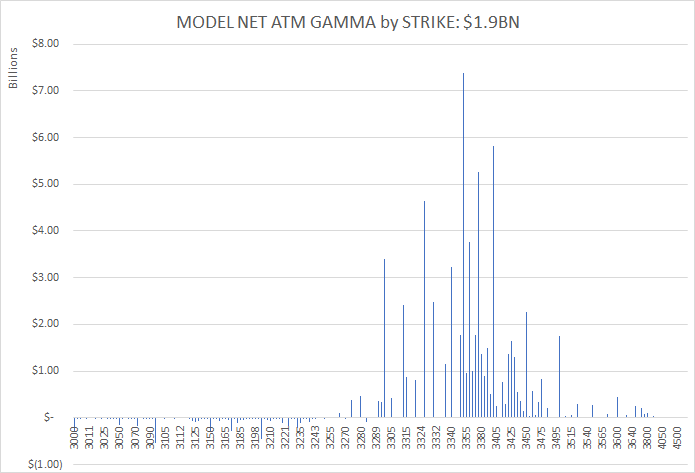
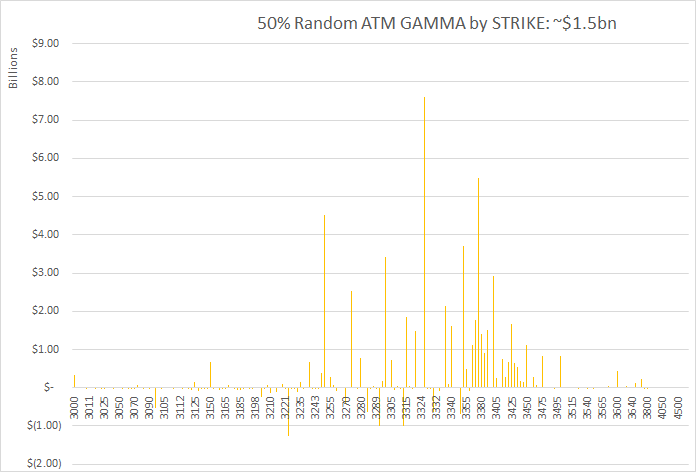
SPX ATM Gamma for Friday 2/8/20 was ~$1.9bn

I then ran a simulation which stepped through adjusting the models assumption from 50-90%. Running 1,000 trails at 10% intervals from 50% to 90%. 70% for example uses 70% of our base assumptions and 30% randomized. This produced the following total gamma levels:

Rate Adj.Simulation Avg GammaPct of Model
50%             835,000,000,000 44%
60%         1,020,000,000,000 54%
70%         1,180,000,000,000 62%
80%         1,400,000,000,000 74%
90%         1,570,000,000,000 83%
100%         1,900,000,000,000

As you can see the adjustments to the model assumption can have a fairly substantial impact on overall market gamma rates. Whats very interesting about these adjustments is that data shows (see chart below) when gamma is over ~$1bn its predicted impact effectively “tops out”. In other words a market with ~$1.5bn total gamma is anticipated to perform in the same way as a market with $2.5bn. For markets with >$1bn the model positioning assumptions could therefore be off by a fair amount and still “predict” the same estimated market return.
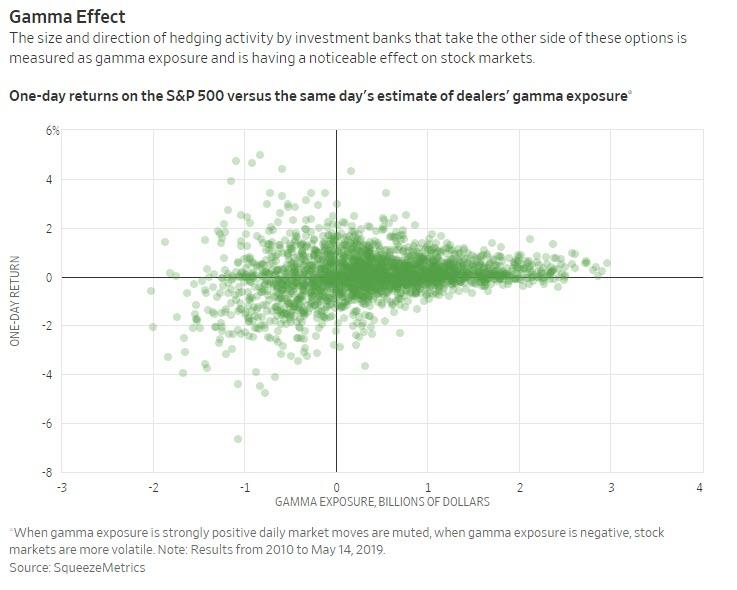
squeezemerics wsj gamma

“Errors” in positioning assumptions for negative gamma periods would arguably matter less as we look for “high volatility” during negative gamma periods. High volatility does not predict direction, just magnitude of price movement. Therefore changes to underlying positions which in turn effect direction may not violate the models estimate of SPX movement.

A more in depth study of adjustment impacts to the position assumptions is certainly warranted.

Its also important to note that much like most traders and investors market gamma is but one key data points to consider, along with other large options-derived levels.

Share This Article

  • Share
  • Twitter
  • LinkedIn
  • Reddit
  • Facebook

Written by SpotGamma · Categorized: Market Analysis · Tagged: deutsche bank, gamma assumptions, gamma model

Don’t have an account with SpotGamma?

Choose the plan you want today to view unique support and resistance levels, access Founder’s Notes and expert commentary, daily trading ranges, and entrance into our private Discord.


Primary Sidebar

Related Resources

  • Options Exchange Monitor — Week of August 15, 2026 (36 SEC notices, 2 CFTC, 0 EDGAR)

    Options Exchange Monitor — Week of August 15, 2026 (36 SEC notices, 2 CFTC, 0 EDGAR)

    August 17, 2026
  • GEX Levels for SPY, QQQ, ES and NQ: Using Index Gamma in Any Product

    GEX Levels for SPY, QQQ, ES and NQ: Using Index Gamma in Any Product

    August 17, 2026
  • How to Trade GEX Levels: A Practical Guide to Gamma-Based Trading

    How to Trade GEX Levels: A Practical Guide to Gamma-Based Trading

    August 17, 2026
  • Free GEX Levels, Charts, and Data: What’s Available and What It’s Actually Worth

    Free GEX Levels, Charts, and Data: What’s Available and What It’s Actually Worth

    August 17, 2026
  • Covered Calls After Assignment: What to Do When the Stock Drops Below Your Cost Basis

    Covered Calls After Assignment: What to Do When the Stock Drops Below Your Cost Basis

    August 17, 2026
  • youtube
  • x
  • Privacy Policy
  • Disclaimer
  • Terms & Conditions
  • Support Center
  • Media
  • Contact Us

©2026 TenTen Capital LLC DBA SpotGamma

All SpotGamma materials, information, and presentations are for educational purposes only and should not be considered specific investment advice nor recommendations. Futures, foreign currency and options trading contains substantial risk and is not for every investor. An investor could potentially lose all or more than the initial investment. Risk capital is money that can be lost without jeopardizing one's financial security or lifestyle. Only risk capital should be used for trading and only those with sufficient risk capital should consider trading. Past performance is not necessarily indicative of future results. Testimonials appearing on this website may not be representative of other clients or customers and is not a guarantee of future performance or success.

View Full Risk Disclosure