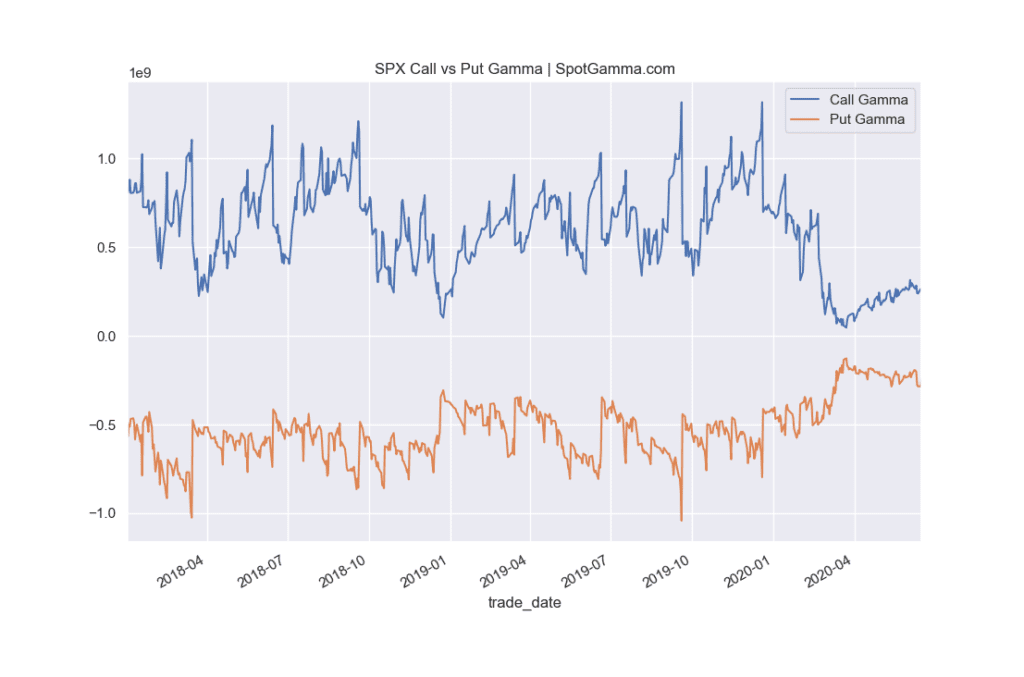
We spend a lot of time talking to our members about the lack of structure in the SPX options market. What we mean is the positioning in SPX options is just very small as seen in this chart below which maps total SPX call & put gamma. This has implications for markets not just at this June expiration, but also going forward.
As shown, despite a very large rally in markets from March lows SPX call interest has not returned to pre-crash levels. We consider SPX options to be the most “institutional” contract due to its larger notional size than say, SPY or individual equities. We have a few speculative reasons as to why call levels have not recovered, but nothing concrete.
Goldman seems to agree about this lack of SPX gamma:

In regards to this small gamma size and June expiration (6/19) we point out the this note from Goldman (via ZH) which is getting a lot of attention. It initially contradicts the gamma data above, but uses a misleading metric to calculate size (OI * SPX PX):
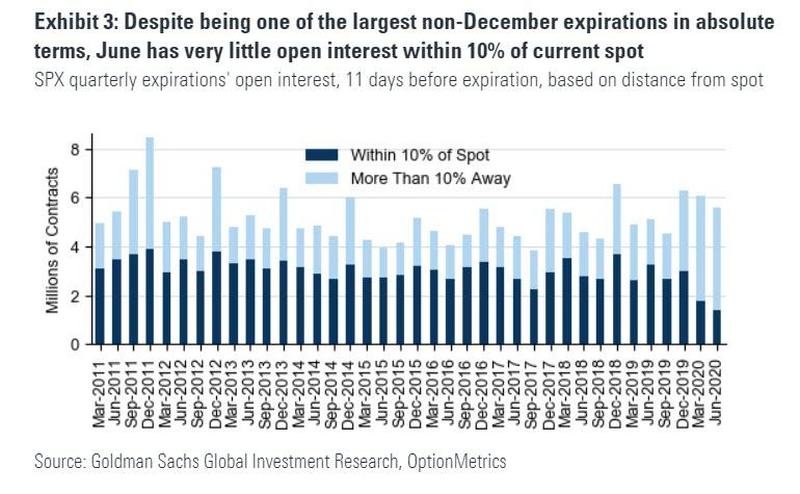
Starting with this Friday’s Op-Ex, Goldman’s Rocky Fishman writes that from a purely “headline” perspective, June’s expiration is massive with $1.8 trillion in SPX options expiring on the 19th…… making it the third-largest non-December expiration on record, in addition to $230bln of SPY options and $250bln of options on SPX and SPX E-mini futures.
However, “re-tweeters” are leaving off the last sentence which gives the real picture:
That said, as a result of the strike distribution heading into Friday, the gross gamma exposure is relatively modest
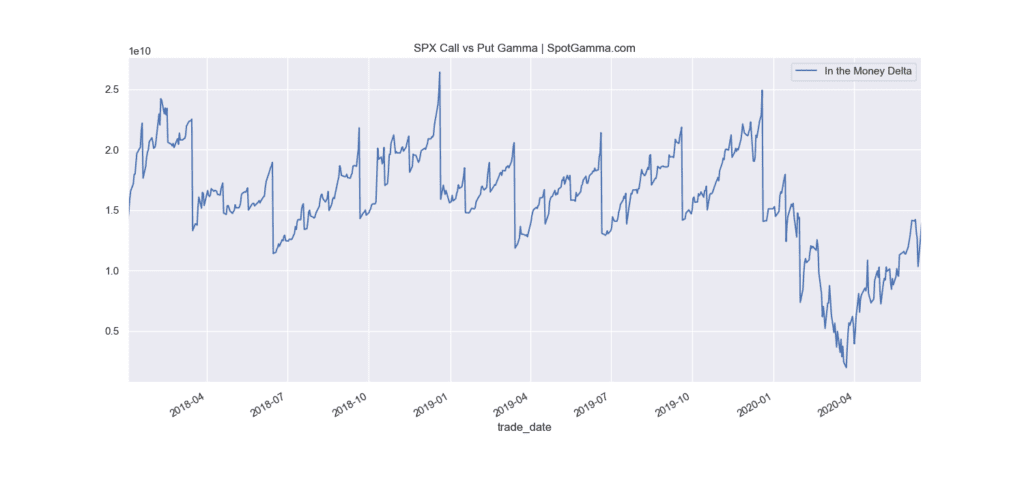
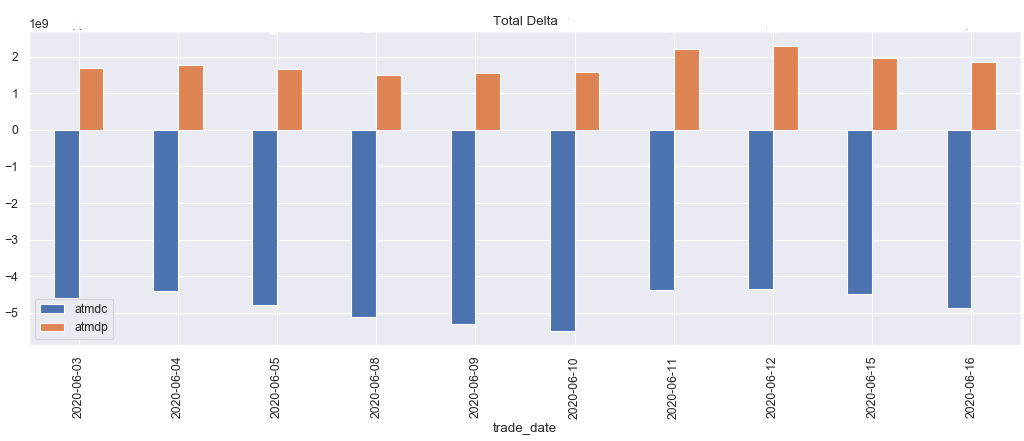
Our delta measurement of SPX options that are in the money don’t appear to register as large, either. This infers again that this expiration does not a lot of hedges to unwind and therein there may not be much impact from an SPX perspective:
However, compare SPX to this chart from SentimentTrader which highlights a massive move in “small trader” call buying in equities. This implies massive participation by retail players and possibly a large gamma position (Note: delta chart at bottom).
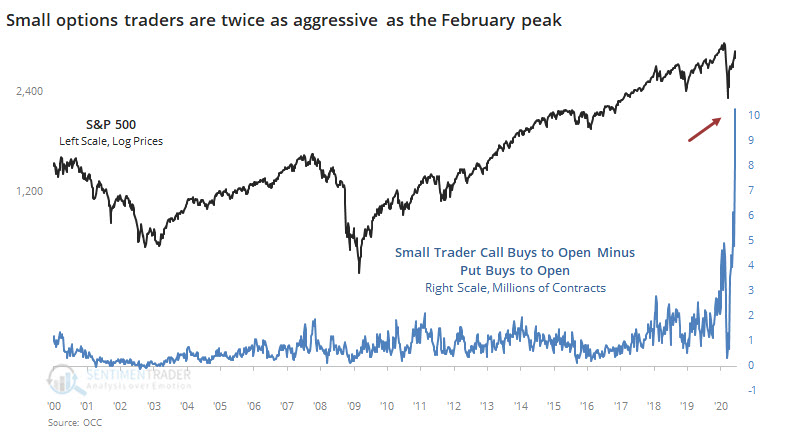
Our data also shows that the most concentrated equity expiration is for this Friday, 6/19 wherein ~50% of equity names have the largest set of options expiring. We’ve talked before about how options expiration can market turning points in markets.
In February ’20 (the last time we had record equity calls) the market crashed immediately following monthly options expiration. The March low was the Monday after expiration. The chart below marks each month options expiration with a red “X”.
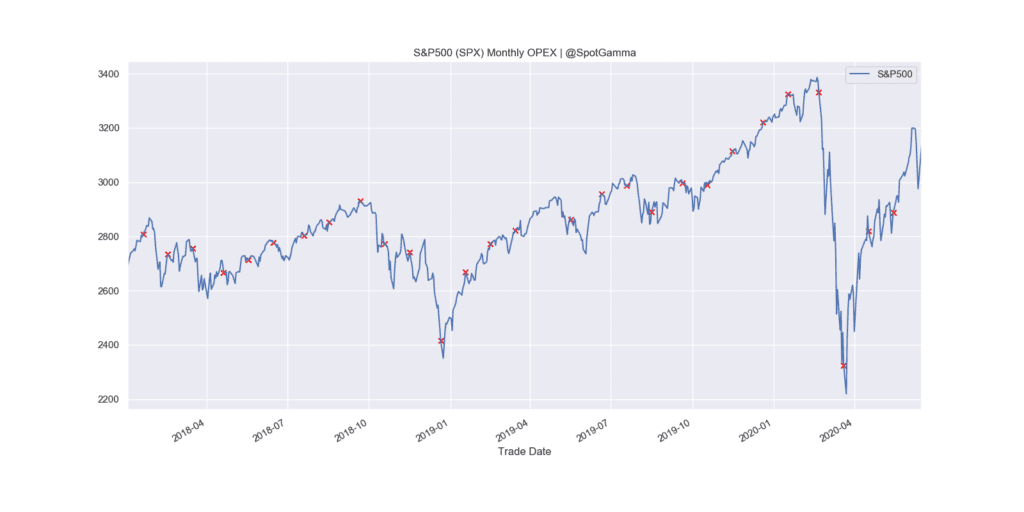
The mechanics of the impact involve option delta more so than gamma. The idea is that options dealers (who are on the short side of all these record long calls) must hedge by buying stock. When the options expire dealers may not require a long stock hedge, so they close it out. In addition they are removed as a repeat buyer in the name as they no longer need to keep buying. We think this re-hedging has helped stocks during this rally.
In Summary
We of course do not know if this Fridays expiration will mark a major turning point in markets, but we do feel that this can serve as a catalyst to fuel a larger move in stocks (i.e. volatility). It appears that the equity positioning is more interesting than current SPX, despite “headlines” making it appear that June SPX expiration is historical size. In our view there is more resistance to the upside, than down. Plus, there the following events making it tough to have a clear forecast:
- SPY goes ex-dividend Friday
- S&P has a massive index rebalance
Finally we note that after June expiration the total options interest in the SPX drops precipitously. This suggests that overall gamma levels will deflate and this may mean higher levels of volatility as we lose positive gamma positions brought by SPX calls.
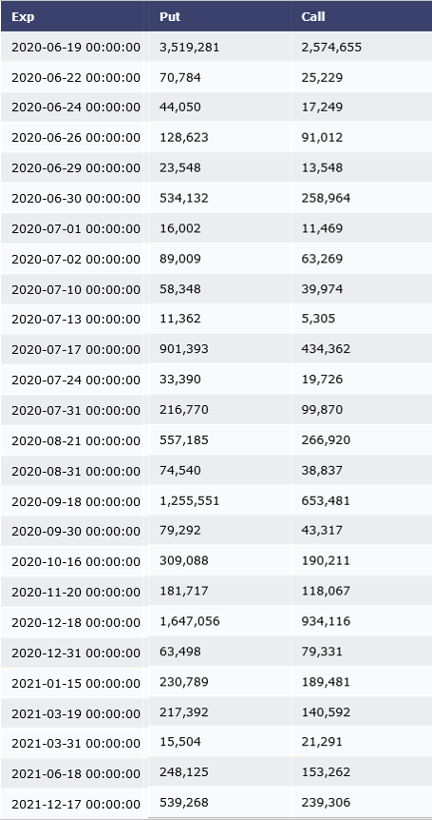
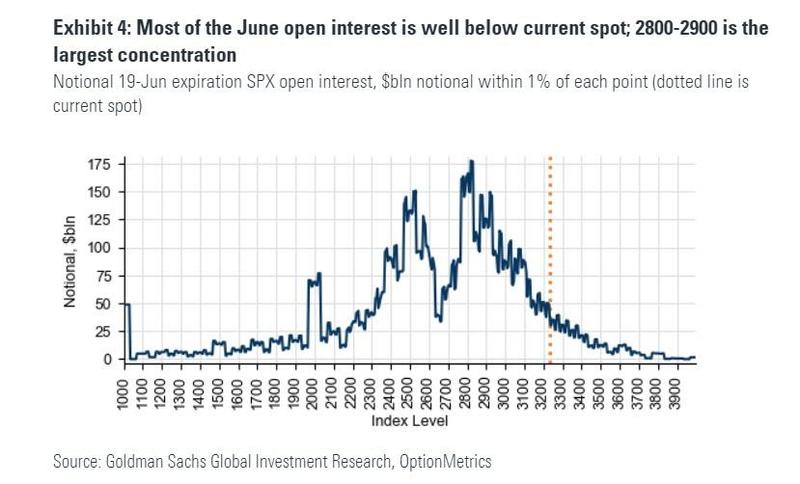
Below are some more charts from the Goldman note: