The following is a guest post from Doug Pless.
When I plan to trade futures, I begin my morning preparation by reading the SpotGamma AM Founder’s Note. For NQ futures, I note Gamma Notional, and the Volatility Trigger, Put Wall, and Call Wall gamma levels for QQQ.
I also look up QQQ in Equity Hub. First, I review the data and note the Hedge Wall and Key Gamma Strike. The Hedge Wall is the strike where the largest change in gamma is detected. The Key Gamma Strike is a strike where volatility may increase or decrease. Both levels can act as pivot or pin areas.
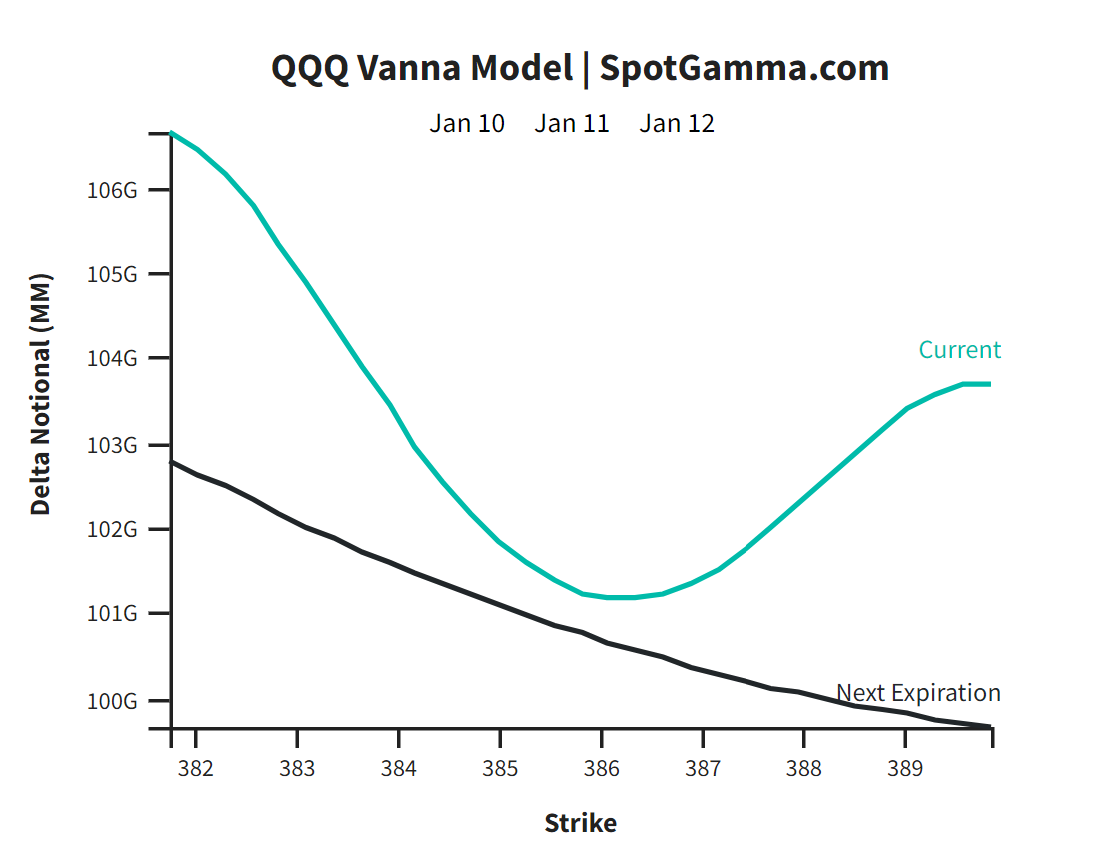
Then I look at the Vanna Model for QQQ. This graph shows how market maker delta exposure may shift as price and implied volatility (IV) move up or down. The slope of the lines indicates how aggressively market makers may have to buy or sell NQ futures to hedge their delta exposure as price and IV change.
Finally, I watch the HIRO Indicator in the first minutes of trade after the RTH open. The HIRO Indicator shows the market maker hedging impact of options trades. Market maker hedging flow can have a significant impact on order flow in NQ and is often a good confirmation of price direction.
Based on this information, I develop a thesis regarding anticipated volatility, trading range, and directional bias for the day. An example of how I used this information to plan and execute a trade is shown below.
Trade Example: January 12, 2022
On January 12, the following metrics for QQQ were shown in the AM Founder’s Note and Equity Hub:
- Gamma Notional: -$348 MM
- Volatility Trigger: 385
- Put Wall: 355
- Call Wall: 400
- Hedge Wall: 390
- Key Gamma Strike: 390
The QQQ Vanna Model for January 12 showed a significant skew with Delta Notional increasing as QQQ drops and decreasing as QQQ rises. This indicates market makers would need to sell NQ futures to hedge their delta exposure as QQQ price moves down and buy NQ futures as QQQ moves up. The QQQ Vanna Model is shown below.
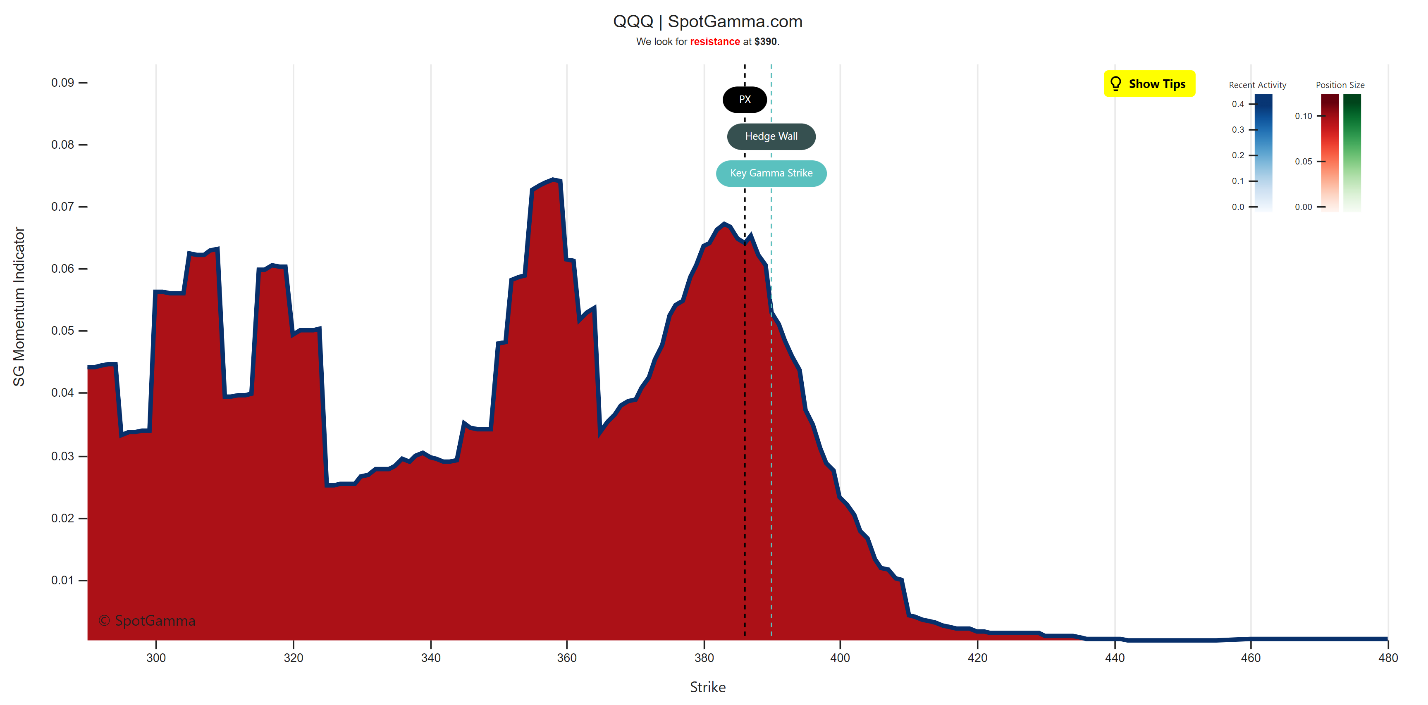
The QQQ SG Momentum Indicator diagram from Equity Hub for January 12 showed the current price level (PX) below the Hedge Wall and Key Gamma Strike at 390, noted as resistance. The bright red color indicates robust options activity and that puts are driving the price action. The QQQ SG Momentum Indicator model from Equity Hub is shown below.
Based on the negative Gamma Notional and skewed Vanna Model, I was looking for a high volatility day with a wide trading range. Market makers would likely be trading with the directional movement of the market rather than against it. I expected large moves and planned to look for opportunities to enter in the direction of the movement. I also expected QQQ 390 to act as resistance.
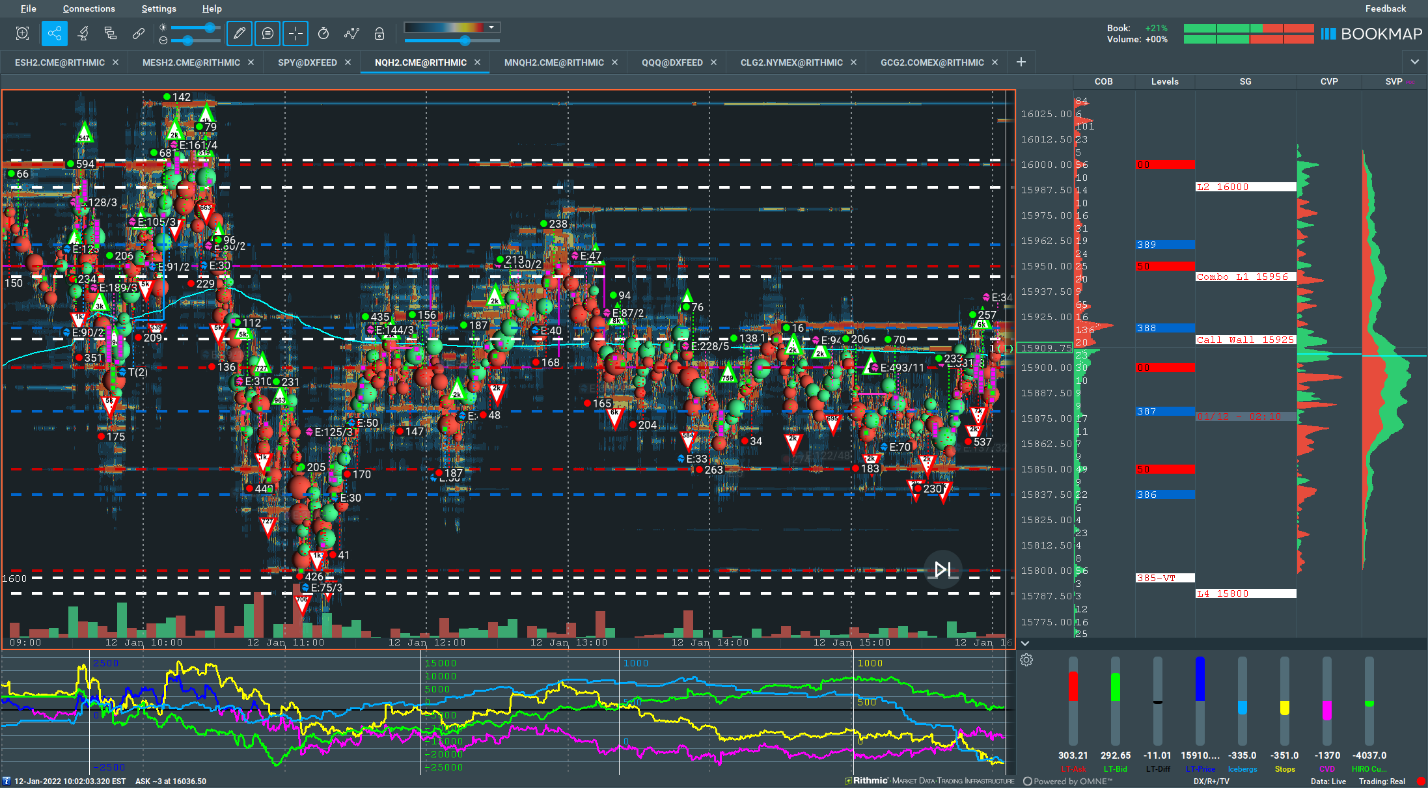
After 10 AM ET, NQ moved up and met resistance at L2 level (NQ 15989, NDX 16000), NQ 16000, and QQQ 390 Key Gamma Strike / Hedge Wall. At the same time, market maker hedging flow was bearish, as shown by the HIRO Indicator in the Bookmap chart below. The indicator showed that market makers were selling NQ futures to hedge bearish option trades in QQQ. Around 10:30 am ET, NQ began to move lower as aggressive sellers stepped in and market makers continued to sell.
Based on the metrics noted above, the Vanna Model, and HIRO, I was looking for opportunities to join the move lower.
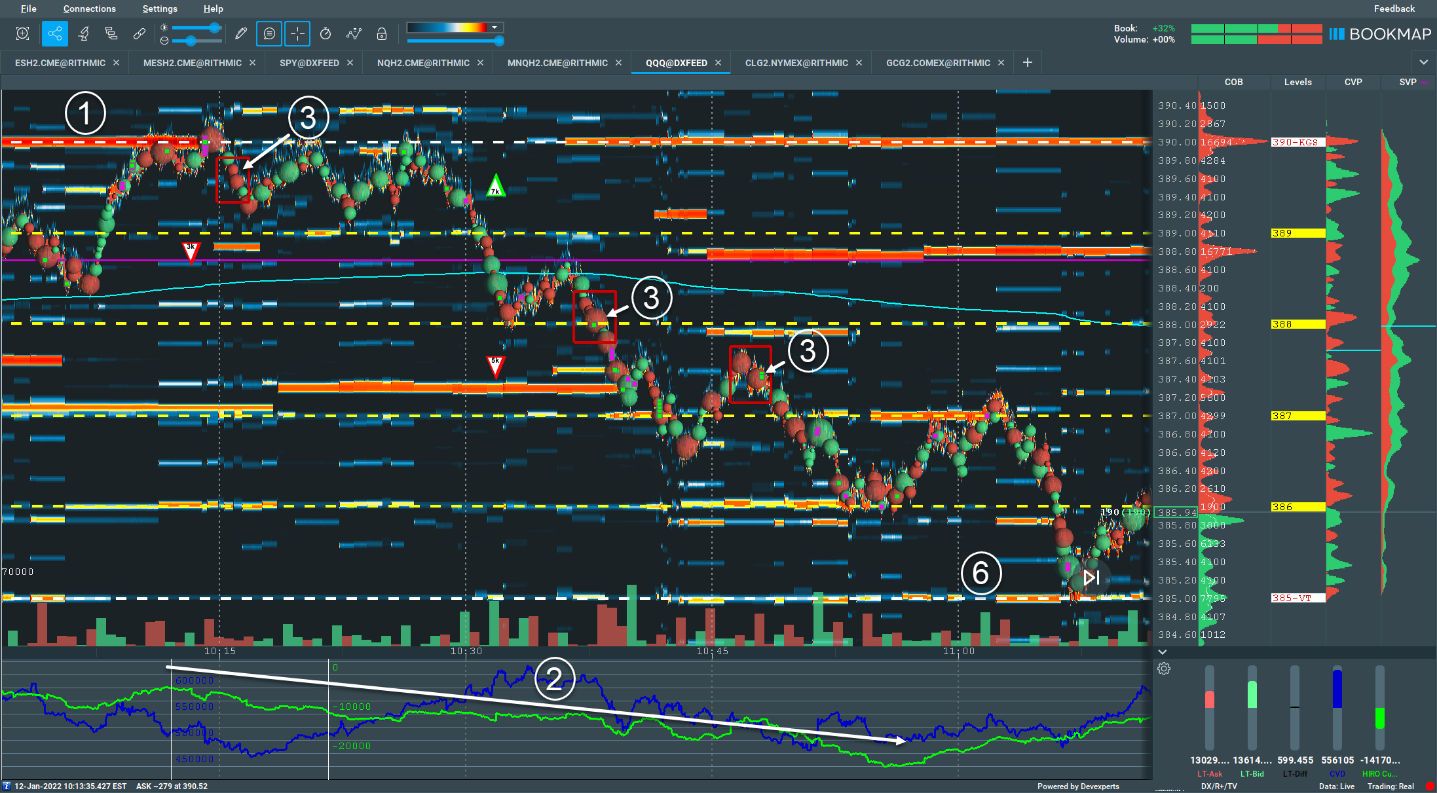
There were several short setups as NQ moved toward targets at Call Wall (NQ 15914, NDX 15925), NQ 15800, L4 level (NQ 15789, NDX 15800), and QQQ 385 Volatility Trigger. The price action in QQQ is shown in the second Bookmap chart below, confirming the reversal at 390 Key Gamma Strike / Hedge Wall and the target at 385 Volatility Trigger.
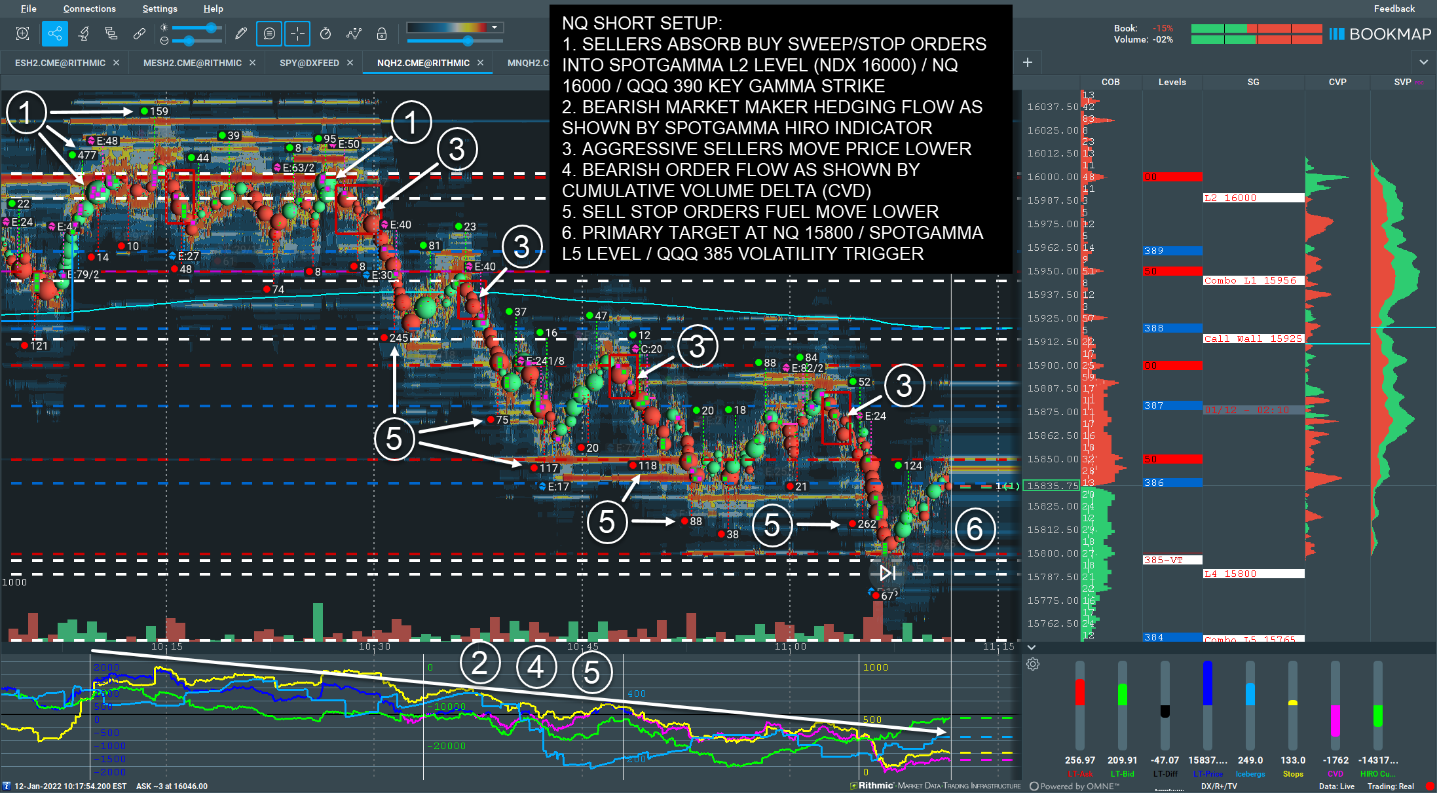
The Bookmap chart below shows how the day played out. After testing L2 level (NQ 15989, NDX 16000) / NQ 16000 / QQQ 390 Key Gamma Strike, NQ trended lower until it reached NQ 15800 / L4 level (NQ 15789, NDX 15800) / QQQ 385 Volatility Trigger. NQ then reversed higher until finding resistance at Combo L1 level (NQ 15945, NDX 15956) / NQ 16950. NQ chopped around for the rest of the session, closing just below the Call Wall. Market maker hedging flow was bearish in the morning and bullish in the afternoon, leading the way lower and higher. NQ moved up and down in a 200-point range for the day, providing several good opportunities to enter long and short positions in the direction of the trend during the day.
For further definitions and information on the terms used in this article, please see the SpotGamma Support Center for a list of dozens of SpotGamma proprietary terms, as well as context for common market terminology.
SpotGamma Products Used:
- SpotGamma Pro
- HIRO Indicator (available on Bookmap)
