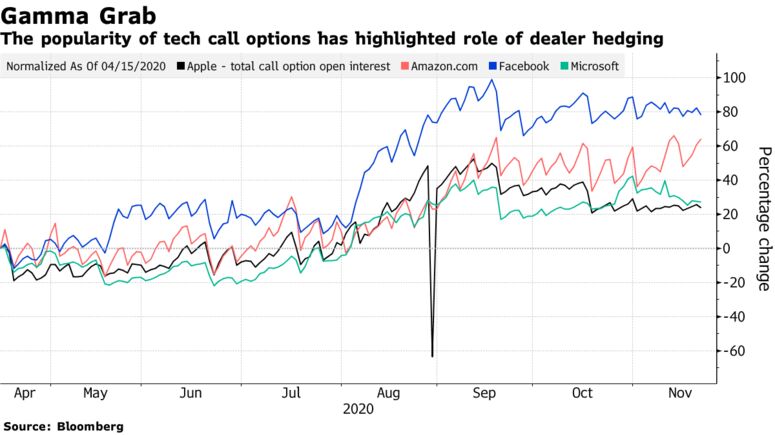
Two professors have just lent academic heft to a suspicion running rampant on Wall Street all year: The options market is whipsawing share prices like never before.
As retail investors spur a boom in derivatives trading to rival actual stock volumes, dealers rushing to hedge themselves are said to have fueled the 2020 melt-up in tech names from Netflix Inc. to Microsoft Corp. They’re also suspected of amplifying two big drawdowns in September and October.ADVERTISING
New research sheds light on just how this dynamic tends to play out.
A study from the Imperial College Business School and the University of St. Gallen has concluded that structural changes to the industry in the past two decades mean dealers are indeed contributing to intra-day volatility as they balance their exposures.
It’s the latest evidence supporting traders who have long argued that the derivatives boom is increasing market fragility. The more mainstream members of the finance community are now playing catch-up.

“This paper is the first high-profile one to really give the idea a proper treatment,” said Matt Zambito of SqueezeMetrics, an analytic service that tracks derivatives exposure. “People are taking these ideas seriously now,” he said.
At the center of it all is what’s known as gamma hedging. That’s when options market makers — the likes of Citadel Securities and Susquehanna International Group — buy or sell an underlying stock to manage their risk as the price of the shares moves.
How the mechanism works depends on each firm’s exposure, but a “negative gamma day” is a session where dealers are generally selling the underlying when it drops and buying when it rises. A “positive gamma day” means they’re buying into weakness and selling into strength.
The researchers examined 300 underlying stocks and indexes with the largest average dollar open interest between 1996 and 2017. They found evidence that dealers during negative gamma days spur an increase in stock gyrations.
Read more: Huge Swings in Options-Overrun Stocks Leave Manager Baffled
“We document a link between large aggregate dealers’ gamma imbalances in illiquid markets and intraday momentum/reversal and market fragility,” authors Andrea Barbon and Andrea Buraschi wrote in a paper this month.
The retail-led explosion in demand for call contracts tied to technology names is making all this more relevant than ever. Trading volumes of single-stock options, for example, recently exceeded regular shares for the first time, according to Goldman Sachs Group Inc. That’s caused some to even suggest that stocks have in effect become a derivative of their underlying options.
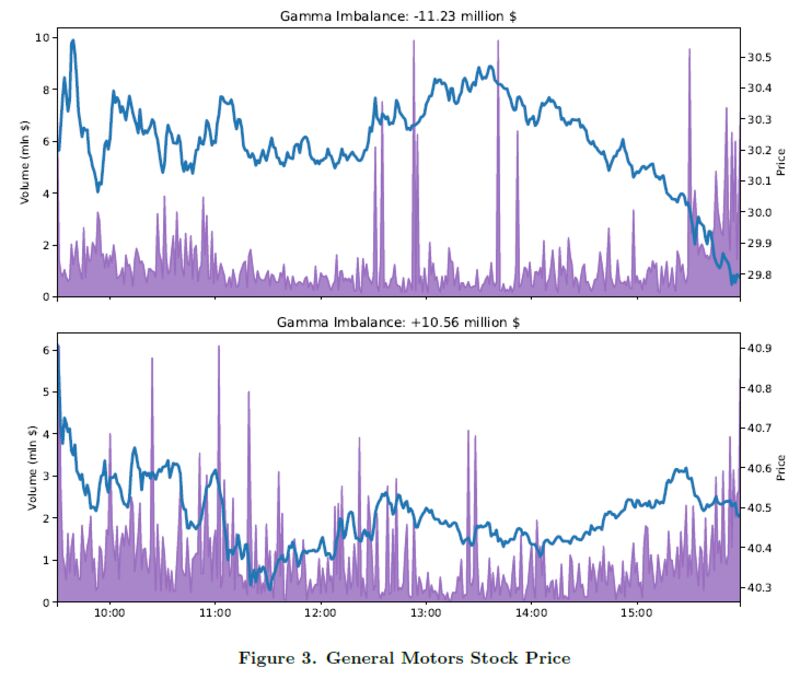
To illustrate their findings, the researchers compare trading in shares of General Motors Co. on two separate days. A session when dealers were “deeply” negative gamma witnessed much higher stock volatility at 24% than on a positive gamma day.
The authors also argued that buying and selling from dealers contributed to intra-day stock momentum — a boost to strategies that seek to ride short-term swings, one of the market’s biggest winners of late.

In addition, the study found that “flash crashes are more likely to occur and to be larger in magnitude” on negative gamma days. In particular, the May 6, 2010 flash crash, which erased more than a trillion dollars in minutes, was likely exacerbated by dealer positioning, the authors write.
One reason for all this is a change in the market backdrop. Even before retail investors started piling into options, insurance companies had posted a “massive increase” in using derivatives for hedging compared with 20 years ago, according to the authors.
Wall Street banks now publish daily estimates on dealer option positioning, alongside analytics services like SqueezeMetrics and SpotGamma. Even as the calculations remain imperfect, they’re an invaluable data source for traders like Yannis Couletsis at Credence Capital Management.
“It doesn’t really matter if you are correct or not in calculating the market’s total gamma exposure,” he said. “The essential thing is you now have a number to follow relative to its previous price action — so you get a quasi sense of how it is moving.”
