• Skip to main content
  • Skip to primary sidebar

SpotGamma™

S&P 500 Stock Market Gamma Trading Levels Based on Options Open Interest

  • About
  • Pricing
  • Academy
  • Resources
    • Tool Demos
    • Case Studies
    • Blog
    • Support Center
    • Free Daily Report
    • Free Trading Tools
      • Options Profit Calculator
      • SPX Gamma Exposure
      • Implied Earnings Moves
      • Volatility Ranking
    • Free Training
    • Report Card
  • Login

Aug 22 2019

Review of Flash Crash of May 6, 2010

Some liquidity notes from SEC review of the “Flash Crash” of 6/10/2010. Day started off with video of riots in Athens. Market was down a few percent and VIX was up. Liquidity started to thin out (from what was already low levels), then a massive futures order came in ($4bn notional). The order was one that typically took a day or two to trade but was entered as a “percentage of volume” order. This pounded the market causing liquidity to vanish, HFT arbitragers spread the fire to SPY and other stocks/markets. JPM says liquidity in present day is ~$250 million (1500 Emini SPY futures) vs $2 billion that day (which the SEC said was low). A bit surprising nothing of this scale has happened recently.

May 6 started as an unusually turbulent day for the markets…the U.S opened to unsettling political and economic news from overseas concerning the European debt crisis. As a result, premiums rose for buying protection against default by the Greek government on their sovereign debt. At about 1 p.m., the Euro began a sharp decline against both the U.S Dollar and Japanese Yen – SEC Report

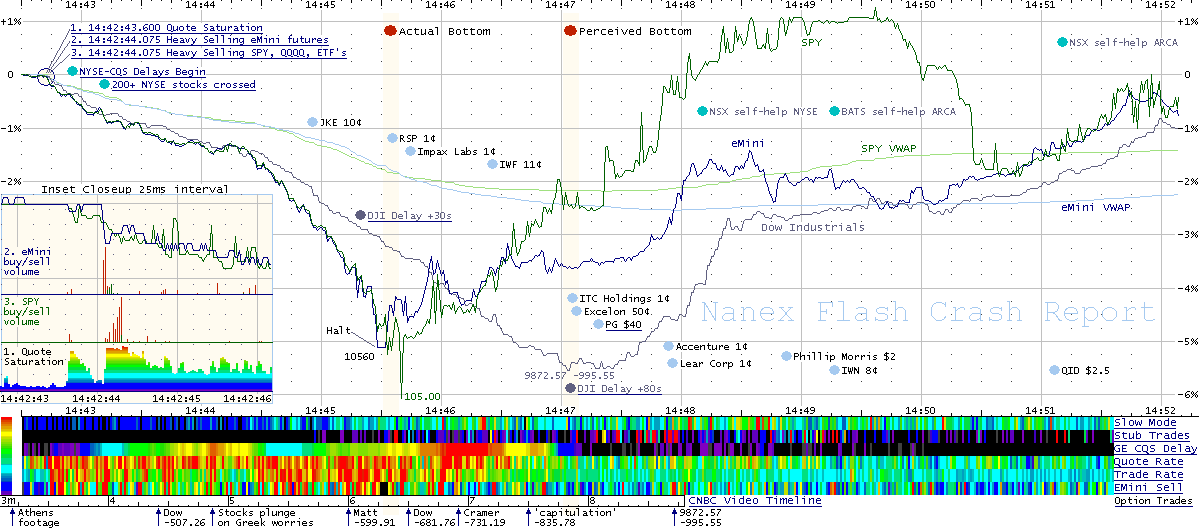
From Nanex:
FlashCrash
From NANEX, chart starts at ~2:45pm

Liquidity in EMINIs went from $6 billion to $2.65 billion.. then:

a large fundamental trader (a mutual fund complex) initiated a sell program to sell a total of 75,000 E-Mini contracts (valued at approximately $4.1 billion) as a hedge to an existing equity position…. This large fundamental trader chose to execute this sell program via an automated execution algorithm…that was programmed to feed orders into the June 2010 E-Mini market to target an execution rate set to 9% of the trading volume calculated over the previous minute, but without regard to price or time…. However, on May 6, when markets were already under stress, the Sell Algorithm chosen by the large trader to only target trading volume, and neither price nor time, executed the sell program extremely rapidly in just 20 minutes. By 2:45:28 there were less than 1,050 contracts of buy-side resting orders int h e E-Mini, representing less than1% of buy-side market depth observed at the beginning of the day. At the same time, buy-side resting orders in SPY fell to about600,000 shares (equivalent to 1,200 E-Mini contracts)representing approximately 25% of its depth at the beginning of the day. – SEC Report

Share This Article

  • Share
  • Twitter
  • LinkedIn
  • Reddit
  • Facebook

Written by SpotGamma · Categorized: Market Analysis · Tagged: flash crash, futures, liquidity

Don’t have an account with SpotGamma?

Choose the plan you want today to view unique support and resistance levels, access Founder’s Notes and expert commentary, daily trading ranges, and entrance into our private Discord.


Primary Sidebar

Related Resources

  • Options Exchange Monitor — Week of August 15, 2026 (36 SEC notices, 2 CFTC, 0 EDGAR)

    Options Exchange Monitor — Week of August 15, 2026 (36 SEC notices, 2 CFTC, 0 EDGAR)

    August 17, 2026
  • GEX Levels for SPY, QQQ, ES and NQ: Using Index Gamma in Any Product

    GEX Levels for SPY, QQQ, ES and NQ: Using Index Gamma in Any Product

    August 17, 2026
  • How to Trade GEX Levels: A Practical Guide to Gamma-Based Trading

    How to Trade GEX Levels: A Practical Guide to Gamma-Based Trading

    August 17, 2026
  • Free GEX Levels, Charts, and Data: What’s Available and What It’s Actually Worth

    Free GEX Levels, Charts, and Data: What’s Available and What It’s Actually Worth

    August 17, 2026
  • Covered Calls After Assignment: What to Do When the Stock Drops Below Your Cost Basis

    Covered Calls After Assignment: What to Do When the Stock Drops Below Your Cost Basis

    August 17, 2026
  • youtube
  • x
  • Privacy Policy
  • Disclaimer
  • Terms & Conditions
  • Support Center
  • Media
  • Contact Us

©2026 TenTen Capital LLC DBA SpotGamma

All SpotGamma materials, information, and presentations are for educational purposes only and should not be considered specific investment advice nor recommendations. Futures, foreign currency and options trading contains substantial risk and is not for every investor. An investor could potentially lose all or more than the initial investment. Risk capital is money that can be lost without jeopardizing one's financial security or lifestyle. Only risk capital should be used for trading and only those with sufficient risk capital should consider trading. Past performance is not necessarily indicative of future results. Testimonials appearing on this website may not be representative of other clients or customers and is not a guarantee of future performance or success.

View Full Risk Disclosure