If The S&P 500 Stalls at 4300, Look Out Below
Macro Theme: |
Key Levels: |
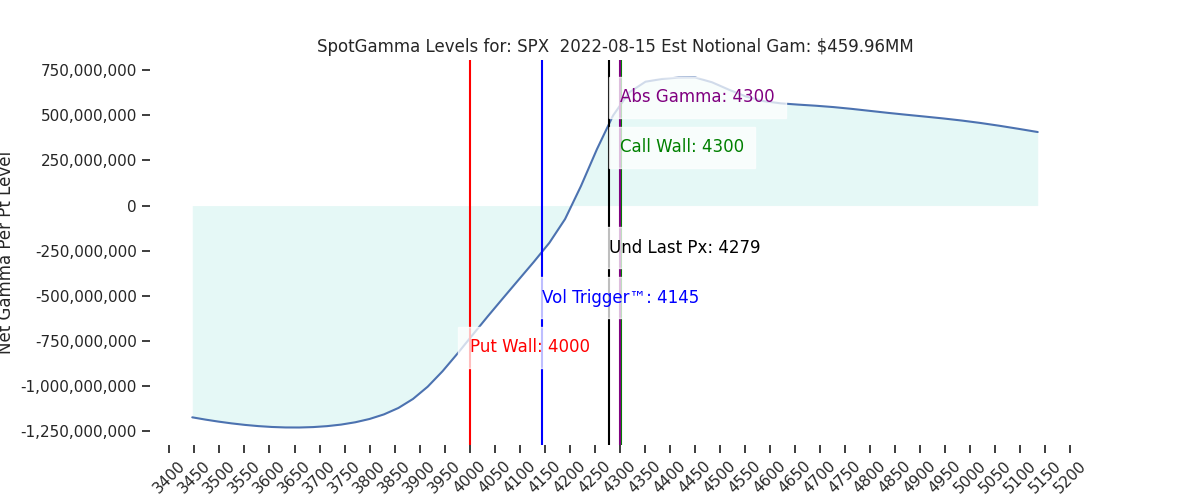
| – Markets maintain a bullish, positive gamma stance; with mean reverting price action & $4,300 now the top of our range into August 19th OPEX – This weeks VIX (8/17) + equity expiration(s) (8/17) may trigger higher market volatility and equity weakness into month end – A break of $4,150 area increases the potential for an accelerated sell-off | Ref Px: 4279 SG Imp Move: 1.16% SG Imp Move (5day): 2.88% Vol Trigger: 4145 Abs Gamma Strike: 4300 Call Wall: 4300 Put Wall: 4000 |
Daily Note:
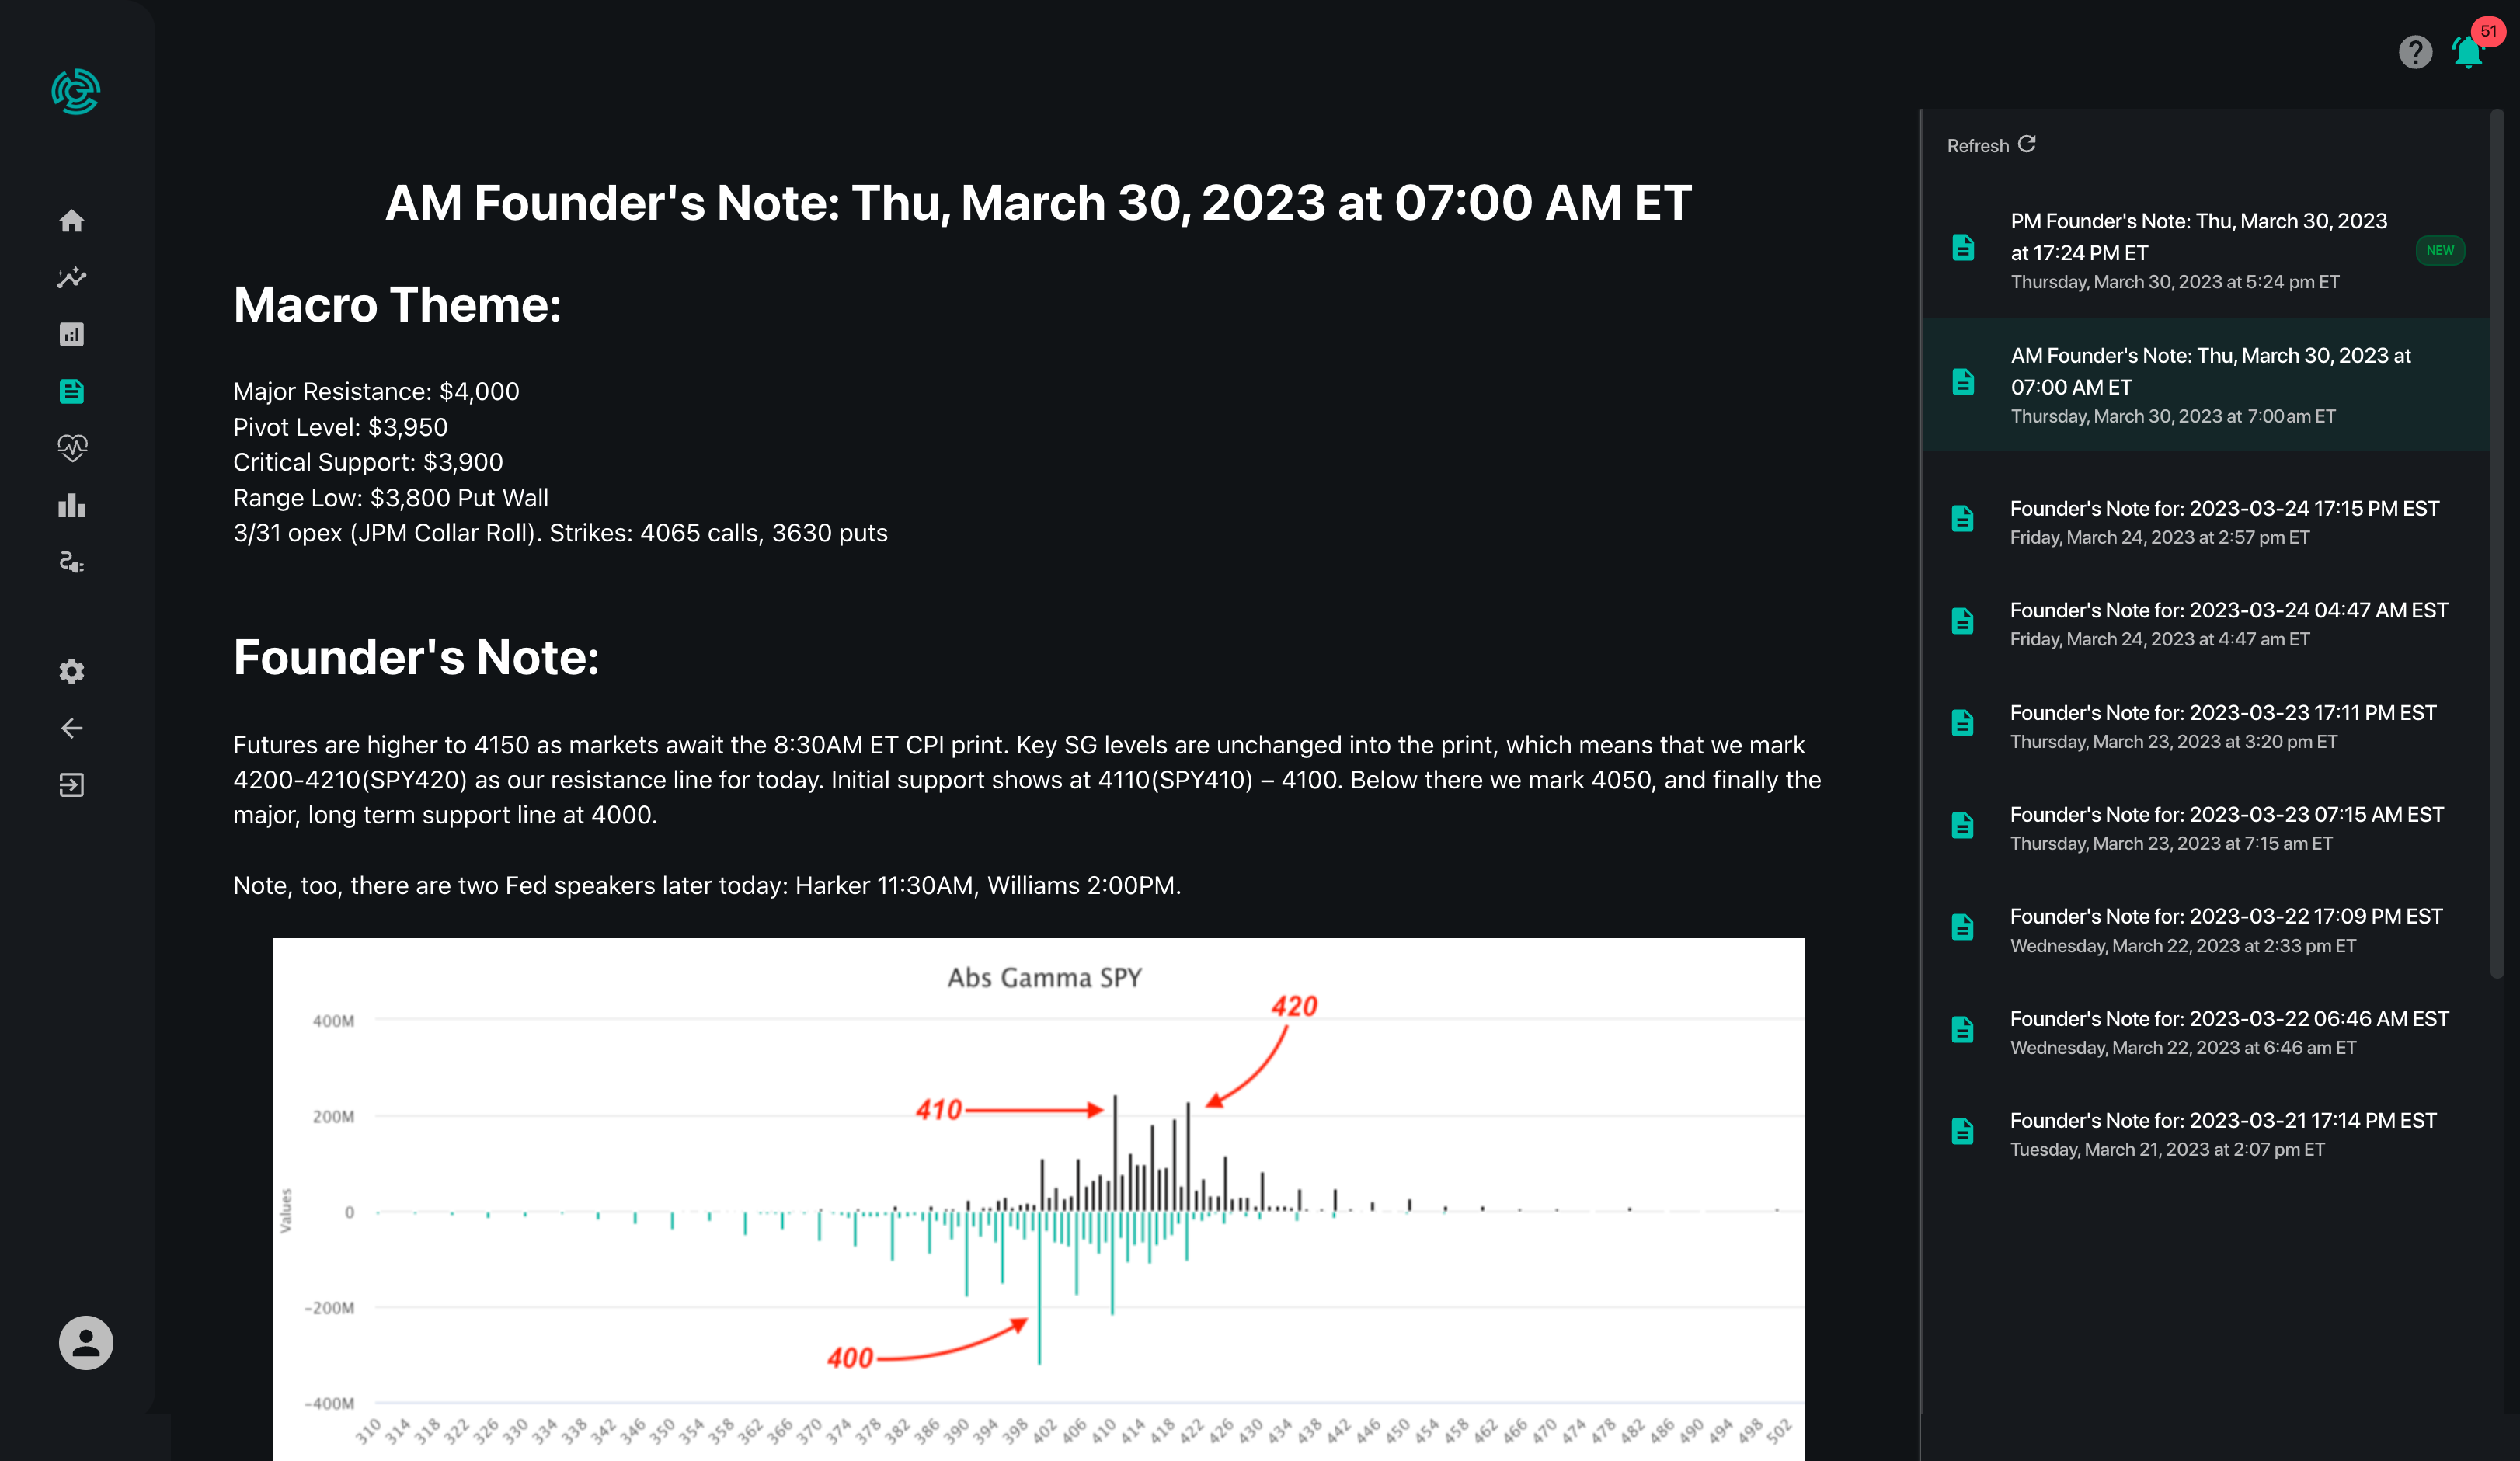
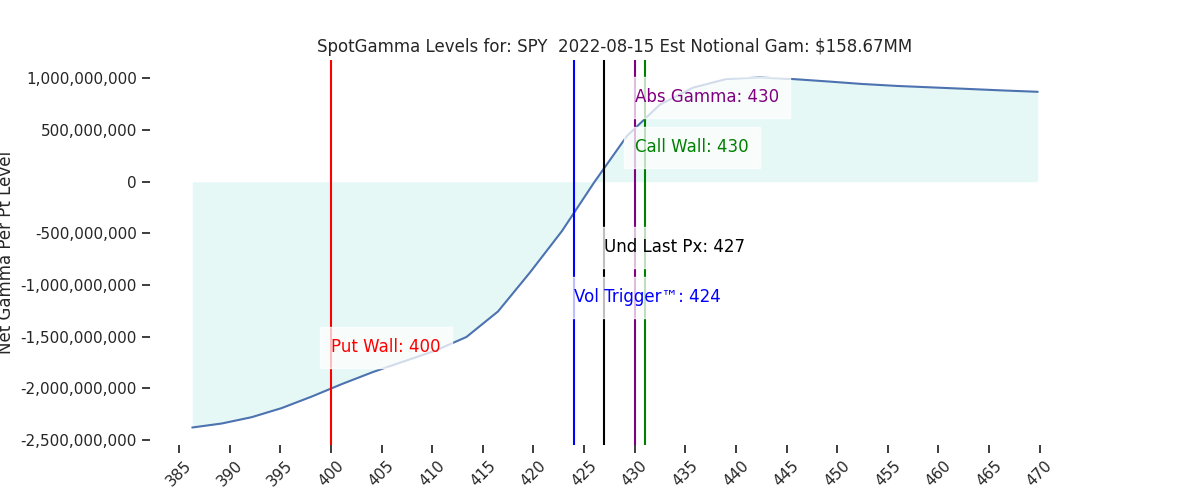
Futures have pulled back some to 4260. Resistance shows at 4300 to 4310 (SPY 430). Support is at 4260 (SPY 425) to 4250, then 4210. We see both 4300 & 4200 in play for today’s session, based on SG’s implied move of 1.16%.
The S&P is up ~11% from July OPEX to today (+16% from June lows!) and Friday brought the first <20 VIX close since mid April. Our view here is that markets are somewhat priced for perfection with IV compressed and large call positions set to expire this week. While we anticipate volatility remaining contained this week, both VIX exp & OPEX could trigger some selling into next week. We do not think the 4300 Call Wall rolls higher before Friday’s expiration.
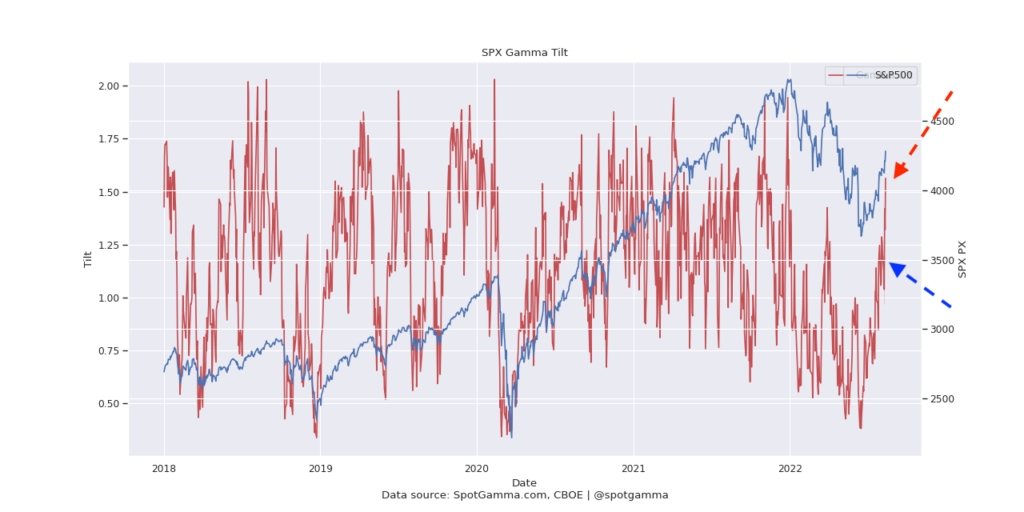
Heading into today we saw the biggest pickup in call gamma since that Mid-April time frame wherein the SPX topped out around 4600. Our gamma tilt indicator (below) measures put gamma/call gamma, and as you can see the indicator surged as call gamma pushed a second leg higher in markets (blue arrow to red arrow). We view the initial move higher (into the blue arrow) resulting from put destruction, and again, a build in calls fueling last weeks move >4200.
This bullish momentum has pushed our Risk Reversal metric to -0.04 which is “max bullish”. This suggests that 30 DTE, OTM puts priced are at their lows relative to equivalent calls. Some traders are also flagging the spike in the SKEW index, too (h/t TME) as a signal that put prices have hit lows.
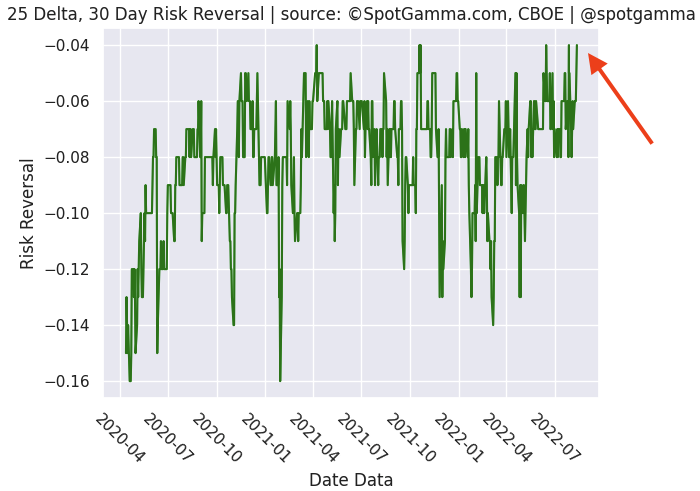
While we don’t offer trading advice, we would note that sometimes the reason to buy options is simply because they are cheap, and based on some skew metrics puts may fit that category.
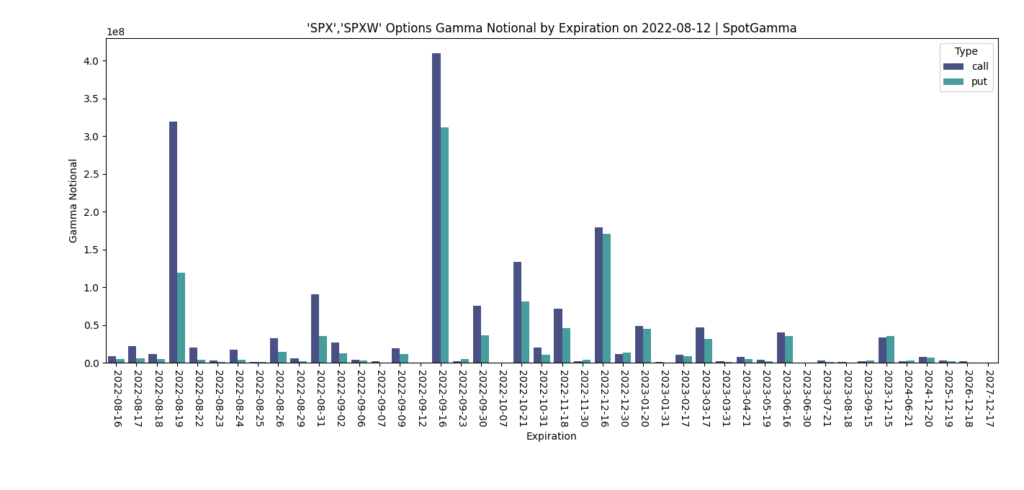
Lastly, as we noted at the top of the post we view this weeks VIX expiration/equity expiration as a trigger for volatility into month end. Below we’ve plotted gamma by expiration for the S&P, and you can see how large the call position is (navy blue) for this Fridays exp (8/19). The idea here is that with ATM call positions expiring there is less stability for the market, which may lead to some equity drawdowns.
| SpotGamma Proprietary SPX Levels | Latest Data | SPX Previous | SPY | NDX | QQQ |
|---|---|---|---|---|---|
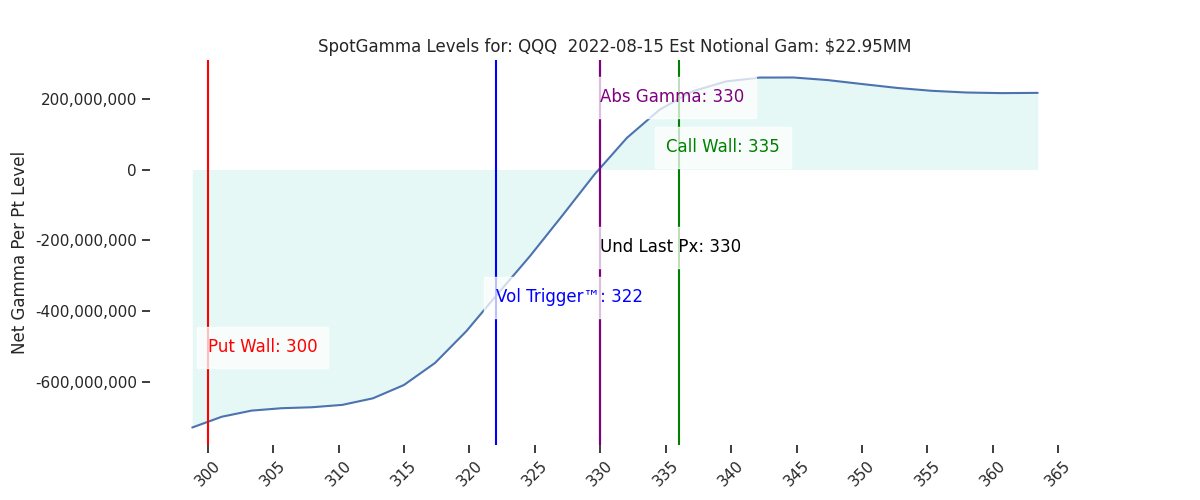
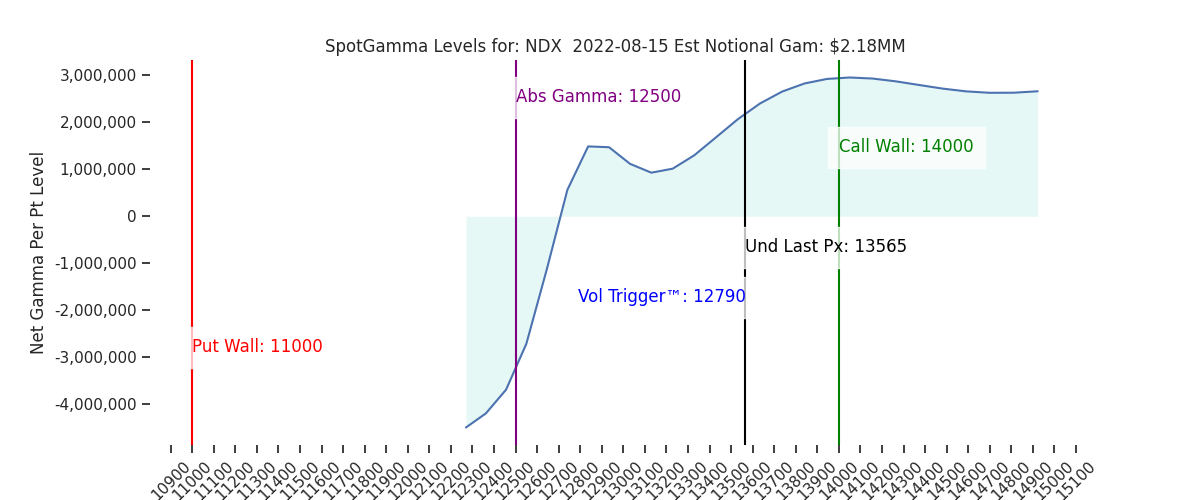
| Ref Price: | 4279 | 4273 | 427 | 13565 | 330 |
| SpotGamma Imp. 1 Day Move: Est 1 StdDev Open to Close Range | 1.16%, | (±pts): 50.0 | VIX 1 Day Impl. Move:1.23% | ||
| SpotGamma Imp. 5 Day Move: | 2.88% | 4279 (Monday Ref Px) | Range: 4156.0 | 4403.0 | ||
| SpotGamma Gamma Index™: | 1.53 | 1.05 | 0.08 | 0.02 | 0.01 |
| Volatility Trigger™: | 4145 | 4000 | 424 | 12790 | 322 |
| SpotGamma Absolute Gamma Strike: | 4300 | 4200 | 430 | 12500 | 330 |
| Gamma Notional(MM): | 460.0 | 651.05 | 159.0 | 2.0 | 23.0 |
| Additional Key Levels | Latest Data | Previous | SPY | NDX | QQQ |
|---|---|---|---|---|---|
| Zero Gamma Level: | 4192 | 4154 | 0 | 0 | 0 |
| Put Wall Support: | 4000 | 3900 | 400 | 11000 | 300 |
| Call Wall Strike: | 4300 | 4300 | 430 | 14000 | 335 |
| CP Gam Tilt: | 1.56 | 1.49 | 1.06 | 1.19 | 1.02 |
| Delta Neutral Px: | 4118 | ||||
| Net Delta(MM): | $1,827,982 | $1,804,829 | $208,731 | $55,075 | $111,563 |
| 25D Risk Reversal | -0.04 | -0.05 | -0.04 | -0.06 | -0.05 |
| Call Volume | 429,029 | 610,718 | 1,278,425 | 4,319 | 535,253 |
| Put Volume | 855,235 | 895,617 | 2,337,242 | 5,119 | 792,633 |
| Call Open Interest | 6,062,078 | 6,310,859 | 7,423,375 | 53,458 | 4,236,725 |
| Put Open Interest | 10,947,409 | 10,668,640 | 13,620,712 | 69,759 | 7,345,916 |
| Key Support & Resistance Strikes: |
|---|
| SPX: [4300, 4250, 4200, 4000] |
| SPY: [430, 425, 420, 415] |
| QQQ: [335, 330, 325, 320] |
| NDX:[14000, 13500, 13000, 12500] |
| SPX Combo (strike, %ile): [4301.0, 4348.0, 4249.0, 4399.0, 4322.0] |
| SPY Combo: [429.24, 433.93, 424.11, 439.06, 431.37] |
| NDX Combo: [13756.0, 13552.0, 13349.0] |
| ©TenTen Capital LLC d.b.a. SpotGamma Please leave us a review: Click Here |
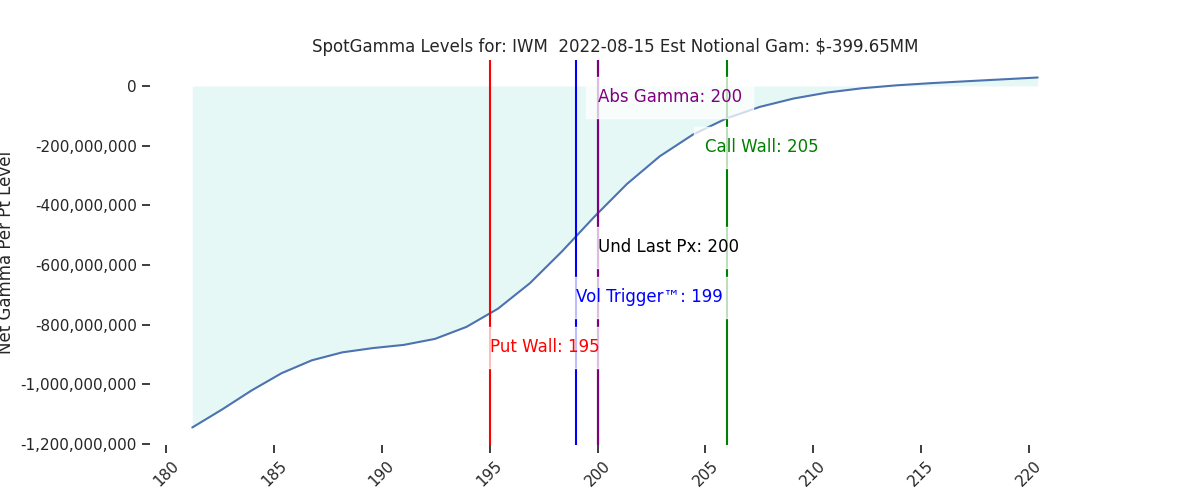
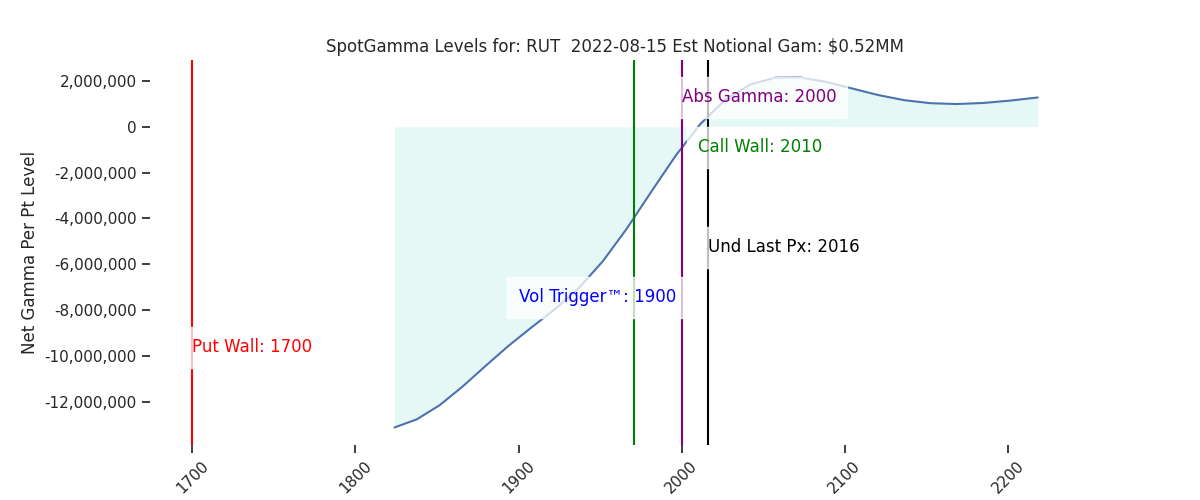
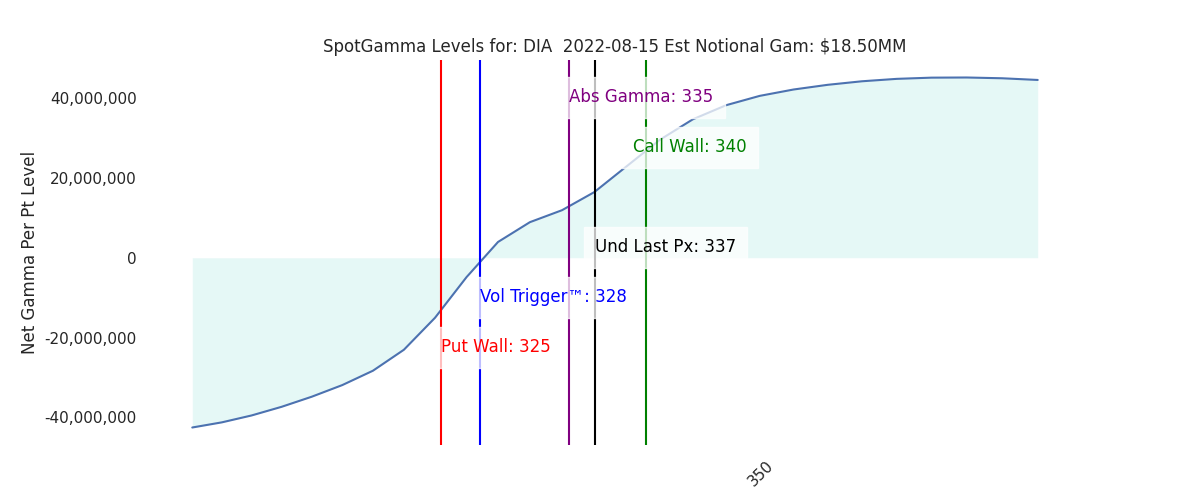
| See the FAQ for more information on reading the SpotGamma graph. |
| SpotGamma provides this information for research purposes only. It is not investment advice. SpotGamma is not qualified to provide investment advice, nor does it guarantee the accuracy of the information provided. This email is intended solely for subscribers, please do not distribute the information without the express written consent of SpotGamma.com. |