Macro Theme: |
Key Levels: |
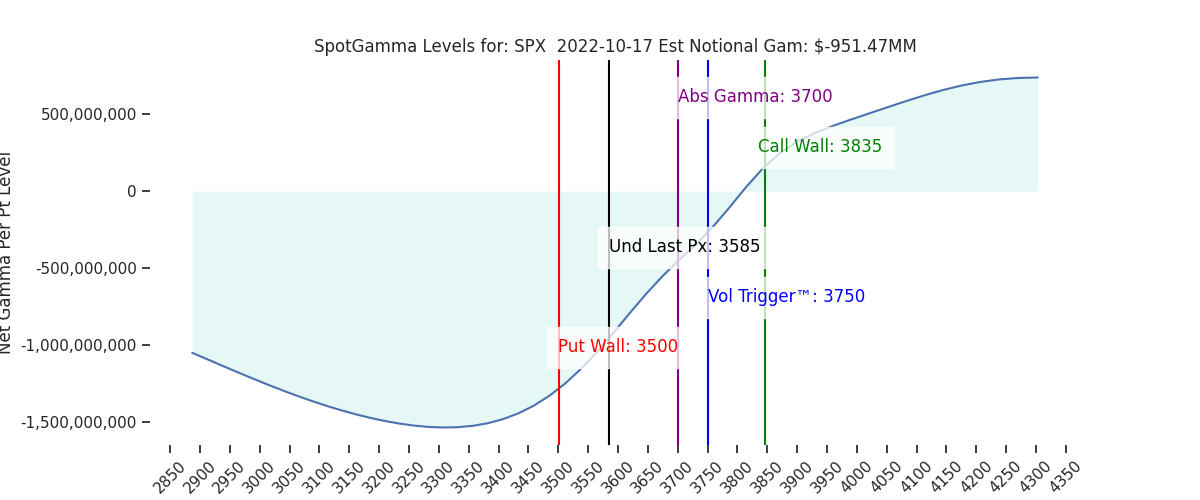
| –> Range Into October OPEX (10/21): Top: 3750 Bottom: 3500 Put Wall –> 10/13 CPI likely triggers a multi-day directional trend to 10/21 OPEX | Ref Price: 3585 SG Implied 1-Day Move: 1.3% SG Implied 5-Day Move: 3.03% Volatility Trigger: 3750 Absolute Gamma Strike: 3700 Call Wall: 3835 Put Wall: 3500 |
Daily Note:
Futures have recovered from Fridays close to 3640. Resistance shows at 3654 then 3700. Support shows at 3600 then 3579.
We are still assigning an edge to a move higher for markets into Friday, with 3750 (Vol Trigger) now the overhead target. This is driven by the idea that IV and put decay should be a tailwind for equity markets.
The last two sessions have been wild, with the S&P traveling 6% from Thursdays low to Fridays high. Despite these massive two day swings, Friday ultimately closed a few bps above Wednesday.
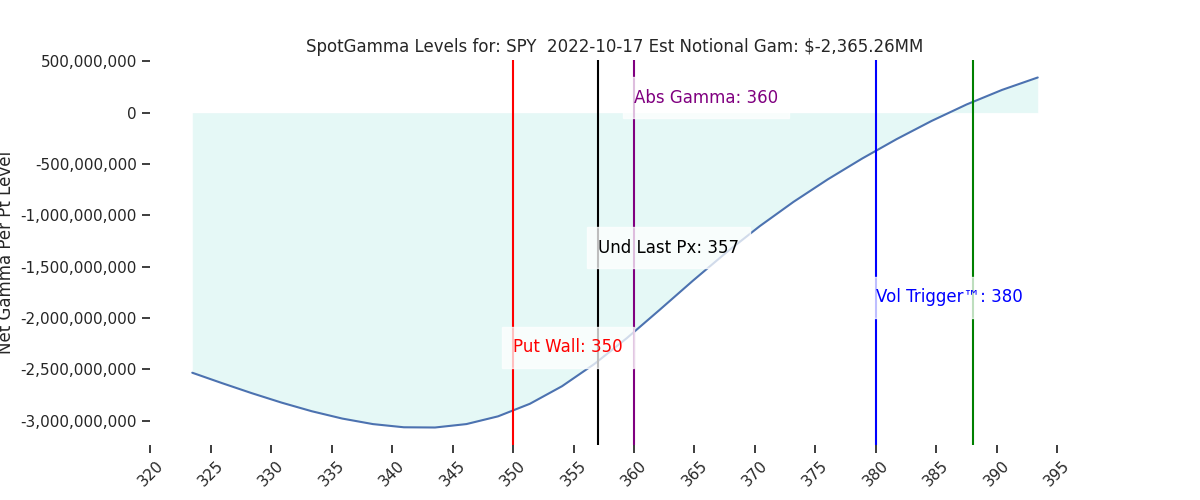
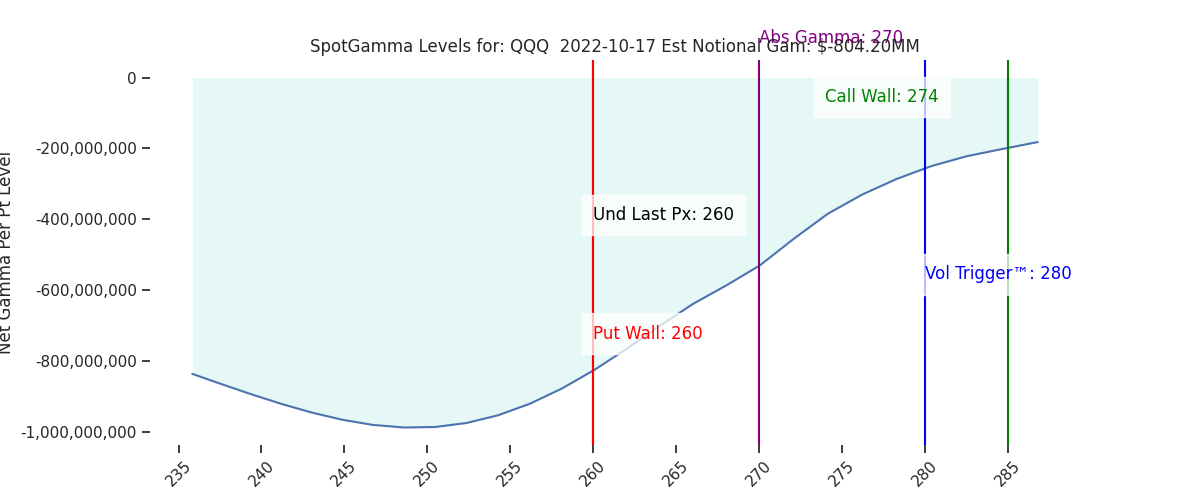
Volume and position changes from Friday reveal heavy call volume at 370/3700 & put volume at 360/3600. It seems that some small put positions were on net closed from 3600 to 3700. This appears to be mostly short dated options puts. This flow may reinforce the support and resistance at 3600 and 3700 respectively.
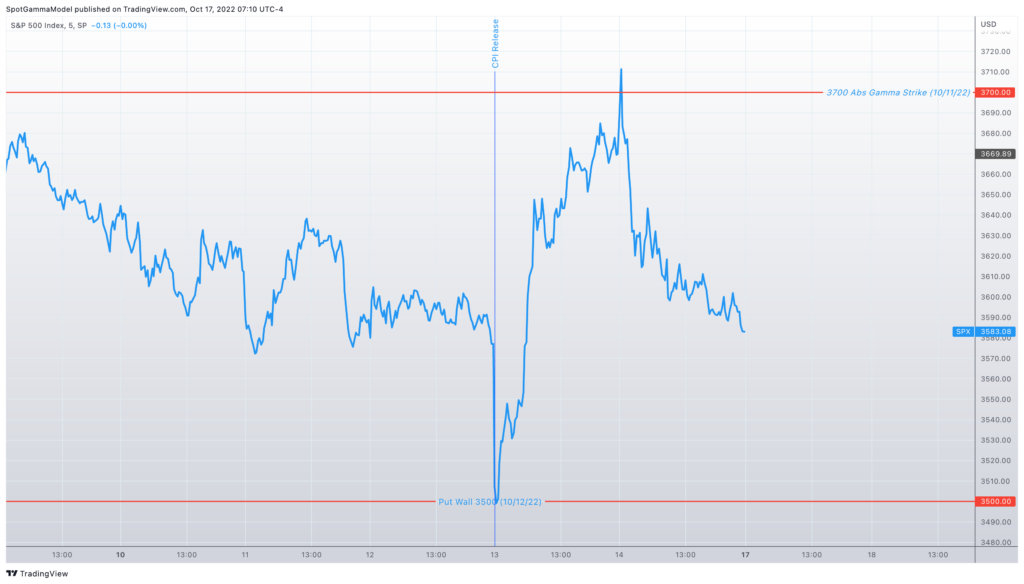
Our view was, and still is, that the market would stage a large directional run from last weeks CPI into this Fridays OPEX. This view was based from the idea that IV was (as remains) quite elevated (i.e. VIX >30) and there is a large, concentrated put position expiring Friday.
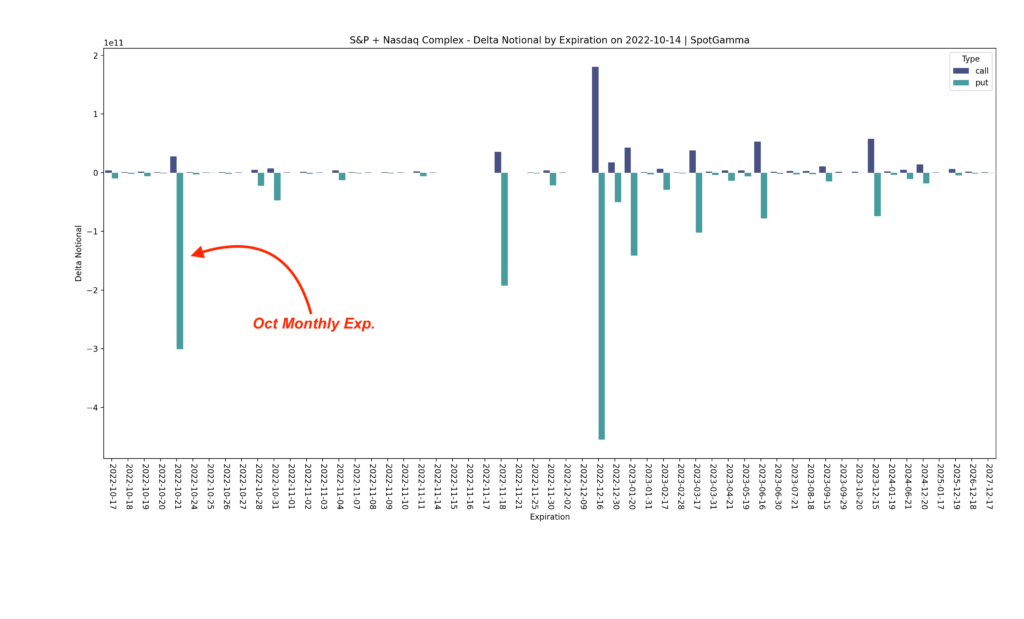
As shown below there is roughly $300bn in total put deltas (teal) expiring across QQQ/NDX/SPY/SPX. This is fairly large size, and in our view enough to impact markets. You may also note there is hardly any call position (navy) tied to Fridays expiration.
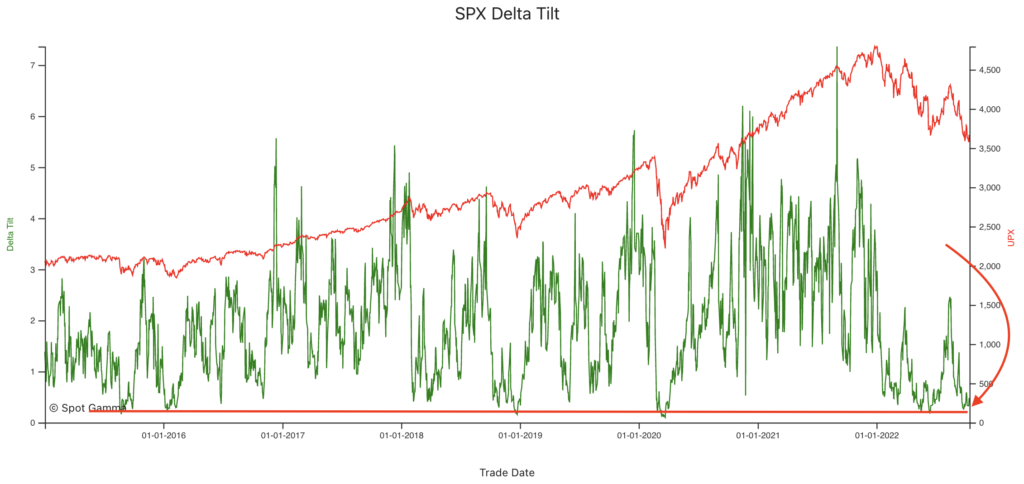
The other issue here for bears is that when the S&P tests the 3500 area, our indicators suggests markets are at “max put” positioning. One of the prime metrics for this is our Delta Tilt indicator, which shows that the ratio of put delta: call delta is at lows that has been related to stock bottoms.
Further, some IV metrics like our Risk Reversal indicator and skew are not showing increased levels of panic (in the form of demand for puts <=3500).
Friday’s expiration will serve to clear out nearly 20% of the put position, which alleviates this max-put position, and may open a window for further downside/new lows into end-of-month. However, before then, the market needs to continue high realized volatility in order for puts to hold their values. That type of volatility is hard to sustain, which is why we favor vanna/charm flows to place a bid into stocks.
There is one other core dynamic which needs to be revisited. As we’ve discussed at length, the amount of options volume concentrated in short dated options is striking. This is something we flagged for the WSJ several weeks ago, and warrants further attention here based on last weeks flow.
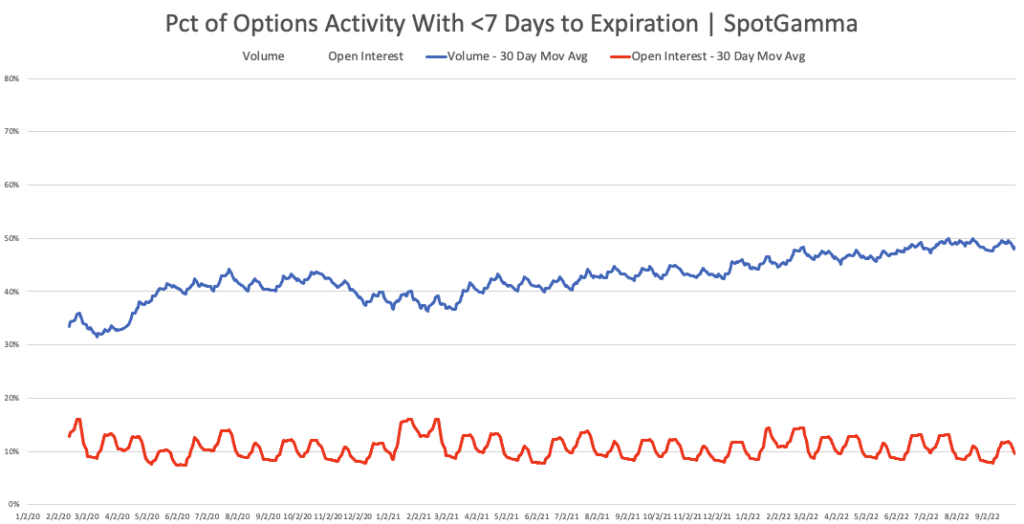
Below is total options activity for options with <= 7 DTE. As you can see nearly 50% of all options volume is for these most short-dated contracts (remember most equities only have weekly Friday expirations, not daily expirations like SPX). Despite this, only 10% of open interest is in expirations with <=7 days. The implication here is that “day trading” flow in the dominant force in options markets, and that is in the overall context of increasing options volumes and lower liquidity.
Last week we calculated that 57% of SPX volume was in options expiring in 2 days or less, while only 4% of open interest is held in those <=2 DTE contracts.
We do not think this is retail, its likely that the bulk of this may come from more sophisticated volatility/HFT entities. Whether the contracts are being used for “risk management” or more speculative views is up for debate, what is less debatable (in our view) is that this flow can inflict large volatility on markets. This is because these positions offer the cheapest of leverage. Its the cheapest leverage because the shortest dated options cost the least from a premium perspective – but their deltas are still just as legitimate as longer dated options. Additionally, shorted dated positions have the highest gamma, and this means these options must be more actively hedged.
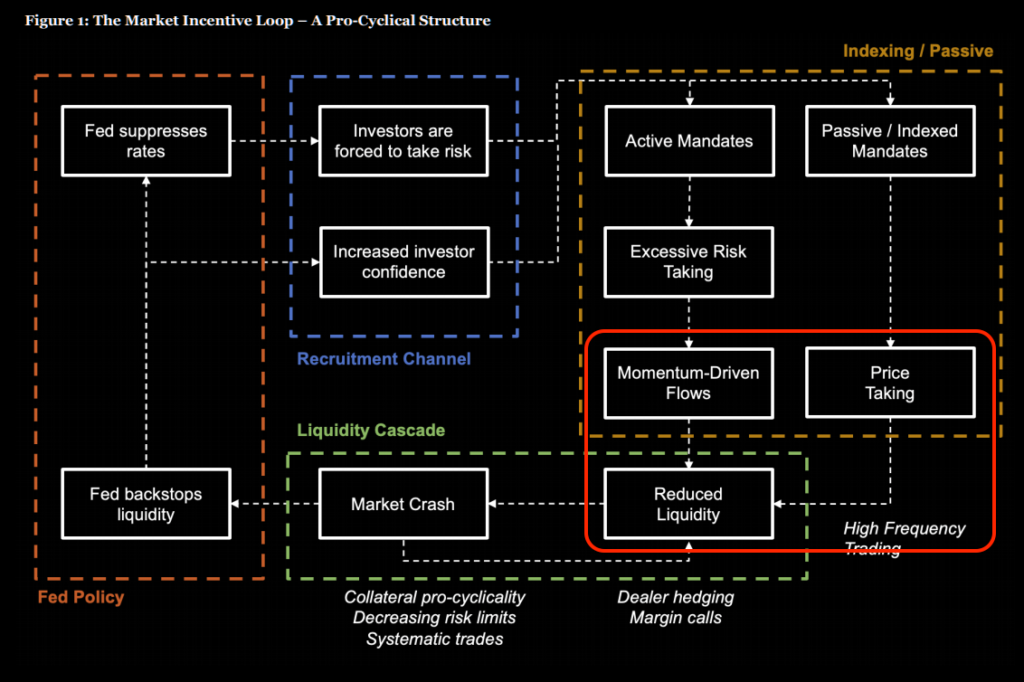
A few years ago Newfound Research put out an interesting piece called “Liquidity Cascades”. Below is a diagram from that note which outlines the feedback loop in markets from Fed policy to market activity. We highlight the bottom right quadrant in red, which is what we mark as our current position. If you believe that options trading invokes dealer hedging – that hedging is both momentum driven flow and price taking. Additionally, market makers cannot wait on a stock bid/ask getting hit/lifted if their risk is too high – they will pay spread and take price. This is what makes that short dated volume from above such an issue in these markets which have lower levels of liquidity. It can amplify volatility in the ways we saw last Thursday and Friday, and have investors trying to draw fundamental conclusions from positional options hedging flows.
| SpotGamma Proprietary SPX Levels | Latest Data | SPX Previous | SPY | NDX | QQQ |
|---|---|---|---|---|---|
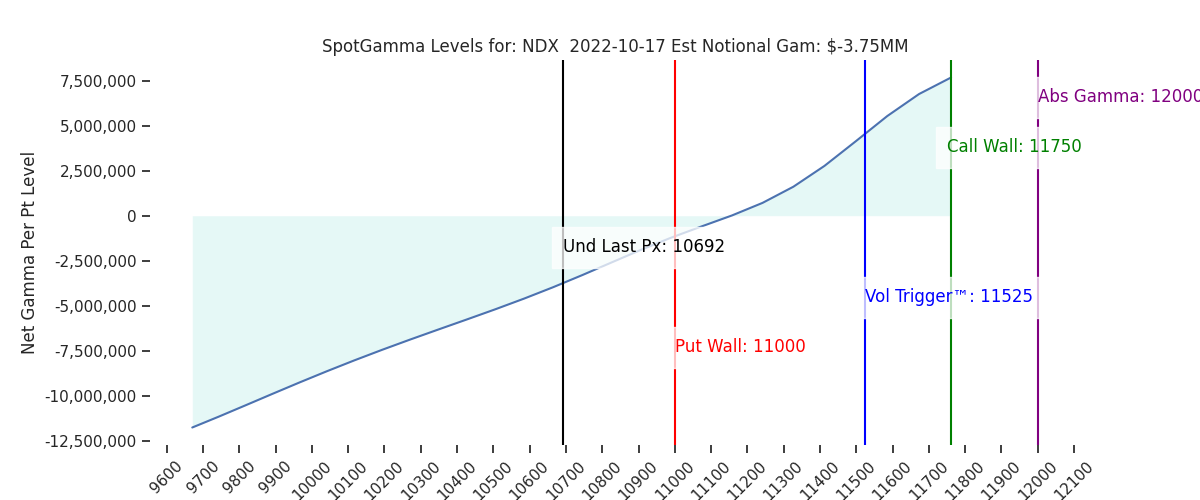
| Ref Price: | 3585 | 3585 | 357 | 10692 | 260 |
| SG Implied 1-Day Move:: | 1.3%, | (±pts): 47.0 | VIX 1 Day Impl. Move:2.02% | ||
| SG Implied 5-Day Move: | 3.03% | 3585 (Monday Ref Price) | Range: 3477.0 | 3694.0 | ||
| SpotGamma Gamma Index™: | -1.67 | -1.67 | -0.42 | -0.02 | -0.11 |
| Volatility Trigger™: | 3750 | 3700 | 380 | 11525 | 280 |
| SpotGamma Absolute Gamma Strike: | 3700 | 3700 | 360 | 12000 | 270 |
| Gamma Notional(MM): | -951.0 | -701.0 | -2365.0 | -4.0 | -804.0 |
| Put Wall: | 3500 | 3500 | 350 | 11000 | 260 |
| Call Wall : | 3835 | 4100 | 420 | 11750 | 274 |
| Additional Key Levels | Latest Data | Previous | SPY | NDX | QQQ |
|---|---|---|---|---|---|
| Zero Gamma Level: | 3797 | 3856 | 385.0 | 11085.0 | 298 |
| CP Gam Tilt: | 0.53 | 0.69 | 0.43 | 0.66 | 0.48 |
| Delta Neutral Px: | 3863 | ||||
| Net Delta(MM): | $1,733,638 | $1,820,293 | $219,731 | $42,701 | $106,075 |
| 25D Risk Reversal | -0.05 | -0.05 | -0.05 | -0.05 | -0.06 |
| Call Volume | 562,089 | 830,619 | 2,522,335 | 7,644 | 900,421 |
| Put Volume | 1,059,692 | 1,214,028 | 3,482,436 | 6,903 | 970,172 |
| Call Open Interest | 7,045,266 | 7,013,584 | 8,559,254 | 64,344 | 5,097,740 |
| Put Open Interest | 11,177,924 | 11,607,281 | 13,908,048 | 75,003 | 6,865,642 |
| Key Support & Resistance Strikes: |
|---|
| SPX: [4000, 3700, 3650, 3600] |
| SPY: [360, 355, 350, 340] |
| QQQ: [280, 270, 265, 260] |
| NDX:[12500, 12000, 11500, 11000] |
| SPX Combo (strike, %ile): [(3704.0, 79.45), (3654.0, 90.27), (3629.0, 76.57), (3607.0, 81.06), (3604.0, 96.69), (3579.0, 79.27), (3557.0, 84.39), (3553.0, 93.11), (3528.0, 87.74), (3507.0, 86.1), (3503.0, 98.31), (3478.0, 78.55), (3453.0, 92.89), (3428.0, 80.84)] |
| SPY Combo: [349.4, 359.42, 354.41, 344.4, 364.42] |
| NDX Combo: [10660.0, 10863.0, 10254.0, 10457.0, 11077.0] |
| ©TenTen Capital LLC d.b.a. SpotGamma Please leave us a review: Click Here |
| See the FAQ for more information on reading the SpotGamma graph. |
| SpotGamma provides this information for research purposes only. It is not investment advice. SpotGamma is not qualified to provide investment advice, nor does it guarantee the accuracy of the information provided. This email is intended solely for subscribers, please do not distribute the information without the express written consent of SpotGamma.com. |