Big Banks Get Stuck… Then Unwind
Before presenting our view on the next potential “gamma squeeze”, we want to share a theory of what may have driven the strong stock market performance over the last few weeks. On March 25th, it was revealed that a large fund, Archegos, had blown up. Archegos did what many large investment houses do – they traded their position on a SWAP basis. This essentially means that the brokers (banks) hold Archegos investments, and in this case, the banks were left holding Archegos investments when the fund imploded. As a result, several banks, including Credit Suisse, were left facing large losses.
At SpotGamma, we are making the assertion that these banks would have been forced to hedge out the long exposure of these SWAPs. After placing these hedges, we now think that (through a tangled web of counterparty risk and hedging) unwinding them could be the driving force behind the recent market rally. The Archegos debacle could have created a larger immediate hedging reaction across any comparative SWAP position, which amplifies the rate of the unhedging action by the banks.
For evidence, the price movement has been steady and progressive since the start of April. Specifically, the S&P500 is up 5%, with 15/16 positive days to start the month. The bid feels mechanical, and each day begins with major blocks of stocks trading as big bank losses are revealed.
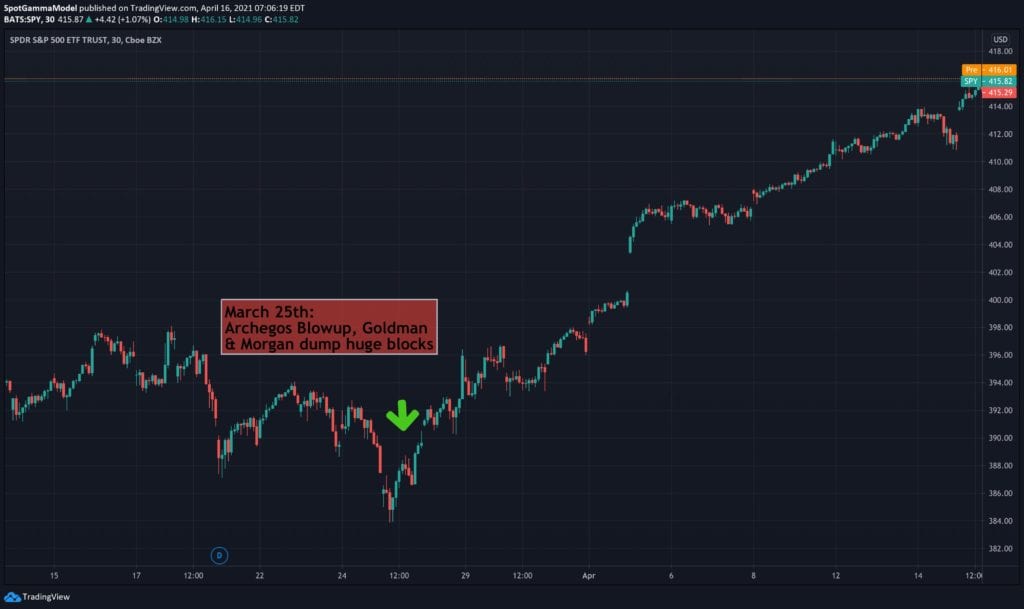
In addition to these large blocks of stock, there is another strange anomaly at hand – more puts are being shorted (sold to open) than bought. Consequently, Goldman pointed out that in addition to this phenomenon, this April’s option’s expiration on Friday (April 16th) was also unusually large for a non-quarterly expiration.
Again, this is our thesis, and it seems to pass our logic test as a very plausible explanation for the consistent bid in markets.
The Next Gamma Squeeze Will Likely be Put-Driven
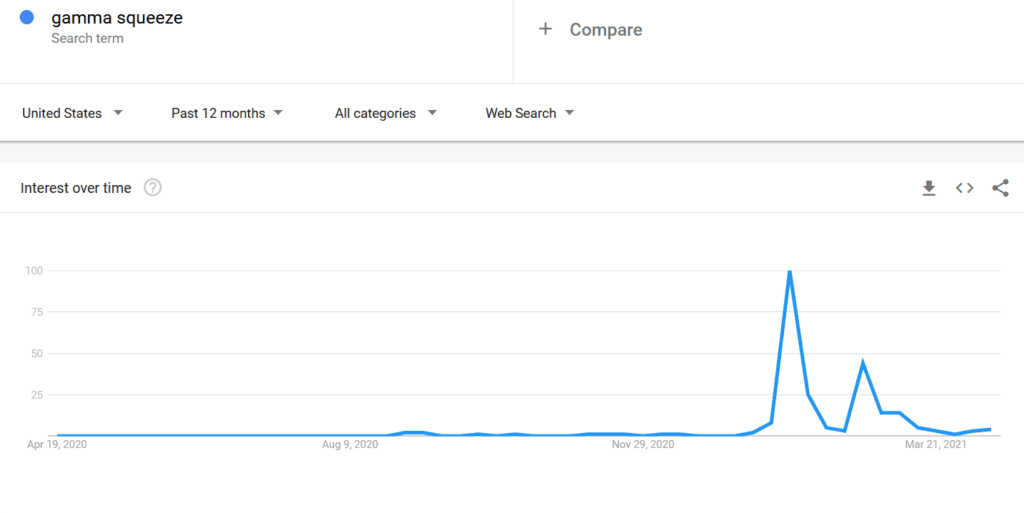
Following our notes over the past year, many of our subscribers are now familiar with “gamma squeezes.” This type of stock and options momentum play became more well-known following the WallStreetBets/GME (TSLA,AMC, BBY, etc) call gamma squeezes that took place in late ’20 and early Q1 of this year. For those of you who may be just learning about Gamma Squeezes, we documented one such example with GameStop (GM) here.
Following the GME example, in March, we documented how market makers were adjusting options prices to prevent further “GME-like” squeezes, and shared an option that this could slow the “call gamma squeeze” phenomenon.
Historically speaking, gamma squeezes have been primarily associated with markets dropping, not rising. This is because often as markets start to selloff, traders seek downside protection by purchasing put options. As traders buy puts, dealers (who are short those puts) must short stock to hedge themselves, further adding to the downward momentum driving a stock’s price lower. This ends up turning into a “reflexive” fear-based feedback loop (as opposed to the greed-based call buying gamma squeeze).
In the case of the last few weeks, somewhat ironically, the new approach market makers have taken toward pricing has not slowed the market from surging to new all-time highs. Thus far in April, the S&P is +5% and the VIX is at post Covid-Crash lows of 16.25.

As further illustration, below is the implied volatility of SPY call and put options going back to Jan of ’21. Each dot represents a different expiration. You can see that implied volatility has now compressed down as volatility has decreased. This implies that the cost of buying options is cheaper relative to any point this quarter, and likely since February of ’20.
The Market Setup is Ripe for Downside Volatility
It is now with markets at all-time highs, and the cost of put options at recent lows that we think the next gamma squeeze will be put driven. Additionally, put purchase volumes in the SPX are actually lower than before the covid-crash. You can see this below in the chart of SPX put option volumes.

With implied volatility having now compressed (ie VIX at new lows), there is now more potential for “long term” volatility.
When implied volatility is very high, it is both very sensitive to market moves and a signal that the markets are expecting more large moves ahead. As soon as markets pause or catch a support level, implied volatility quickly reverses lower. We often think of this analogy that if a shark stops swimming, it sinks ( partially true!). Similarly, if the market stops selling off then implied volatility sinks.
With this, as we often discuss, lower levels of implied volatility (lower VIX) signals market makers have to buy back short hedges which fuels rallies.
This current level of lower implied volatility now gives the market more downside firepower. Starting with a lower implied volatility “slows down” that responsive “snap-back” buying mechanism. Additionally, gamma is higher when IV is lower so gamma flips may have more juice.
Couple this with some strange market anomalies and historically low put volumes and we have the ingredients for a sharp “put driven” squeeze lower.