Advanced Micro Devices (AMD) reports third-quarter earnings Tuesday, November 3, after the close. Investors will focus on AI accelerators, data center growth, and the next-generation Helios platform.
Following a sharp pullback from October highs, AMD faces an important test: can stronger AI fundamentals offset cautious positioning and demanding expectations for 2027? Tuesday’s intraday rebound also makes it essential to distinguish fresh pricing from dealer maps anchored to the previous close.
1. What Is the Options Market Pricing?
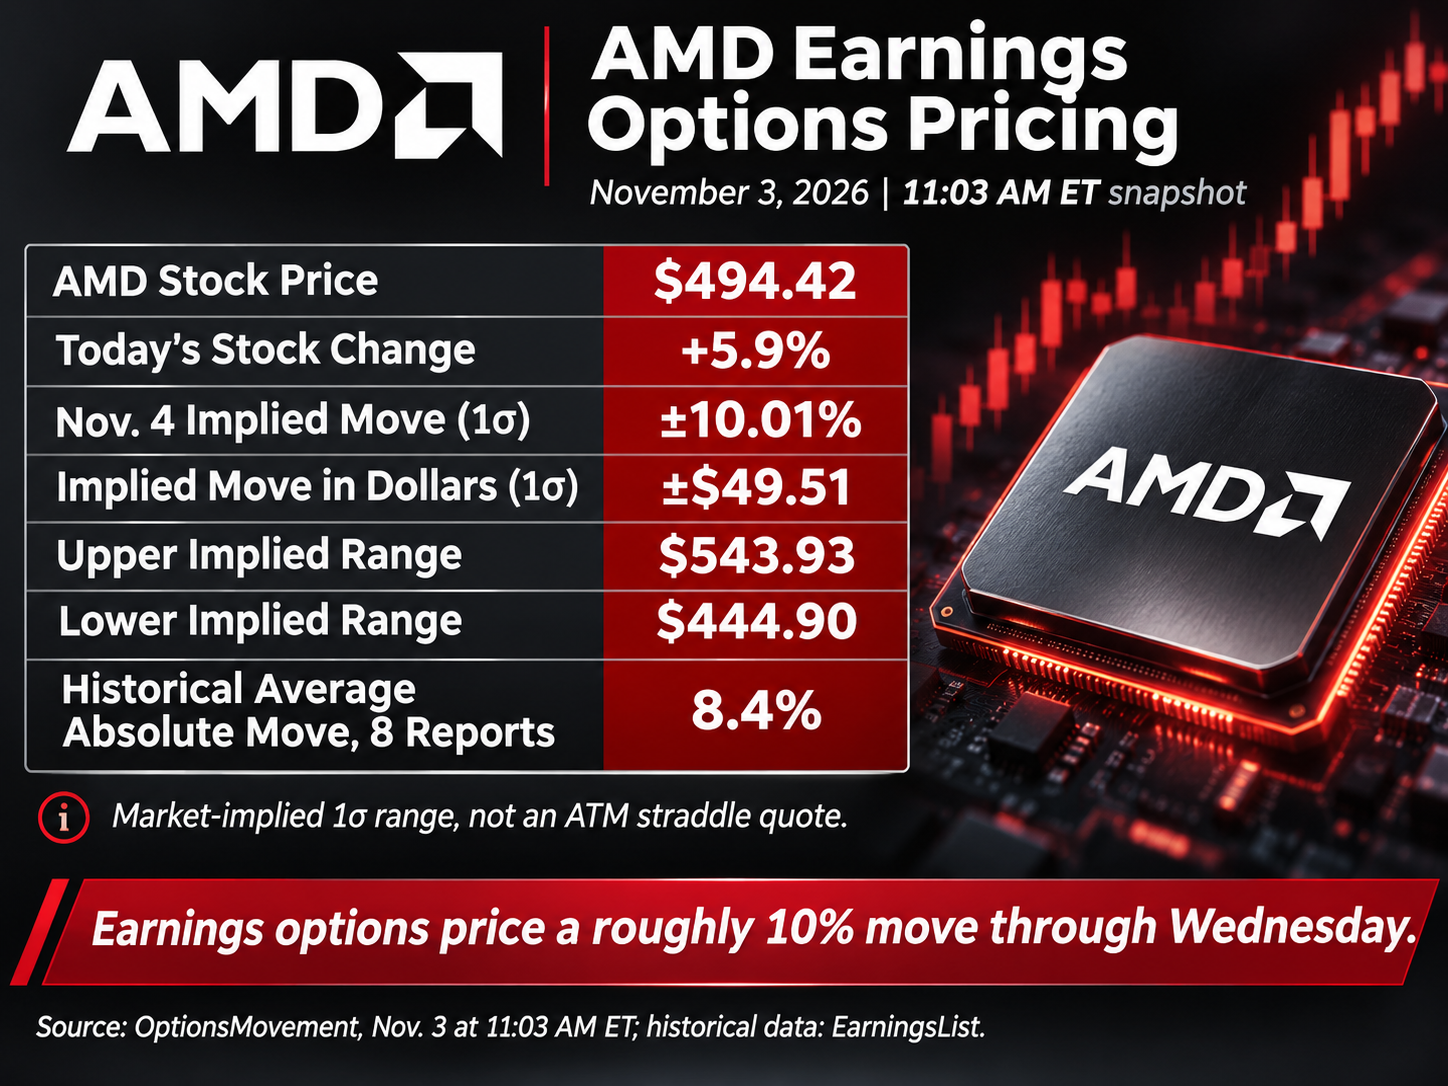
Using AMD near $494.42 as of Tuesday’s 11:03 AM ET snapshot, options imply a roughly ±10% move through November 4, or an approximate $445-$544 range.
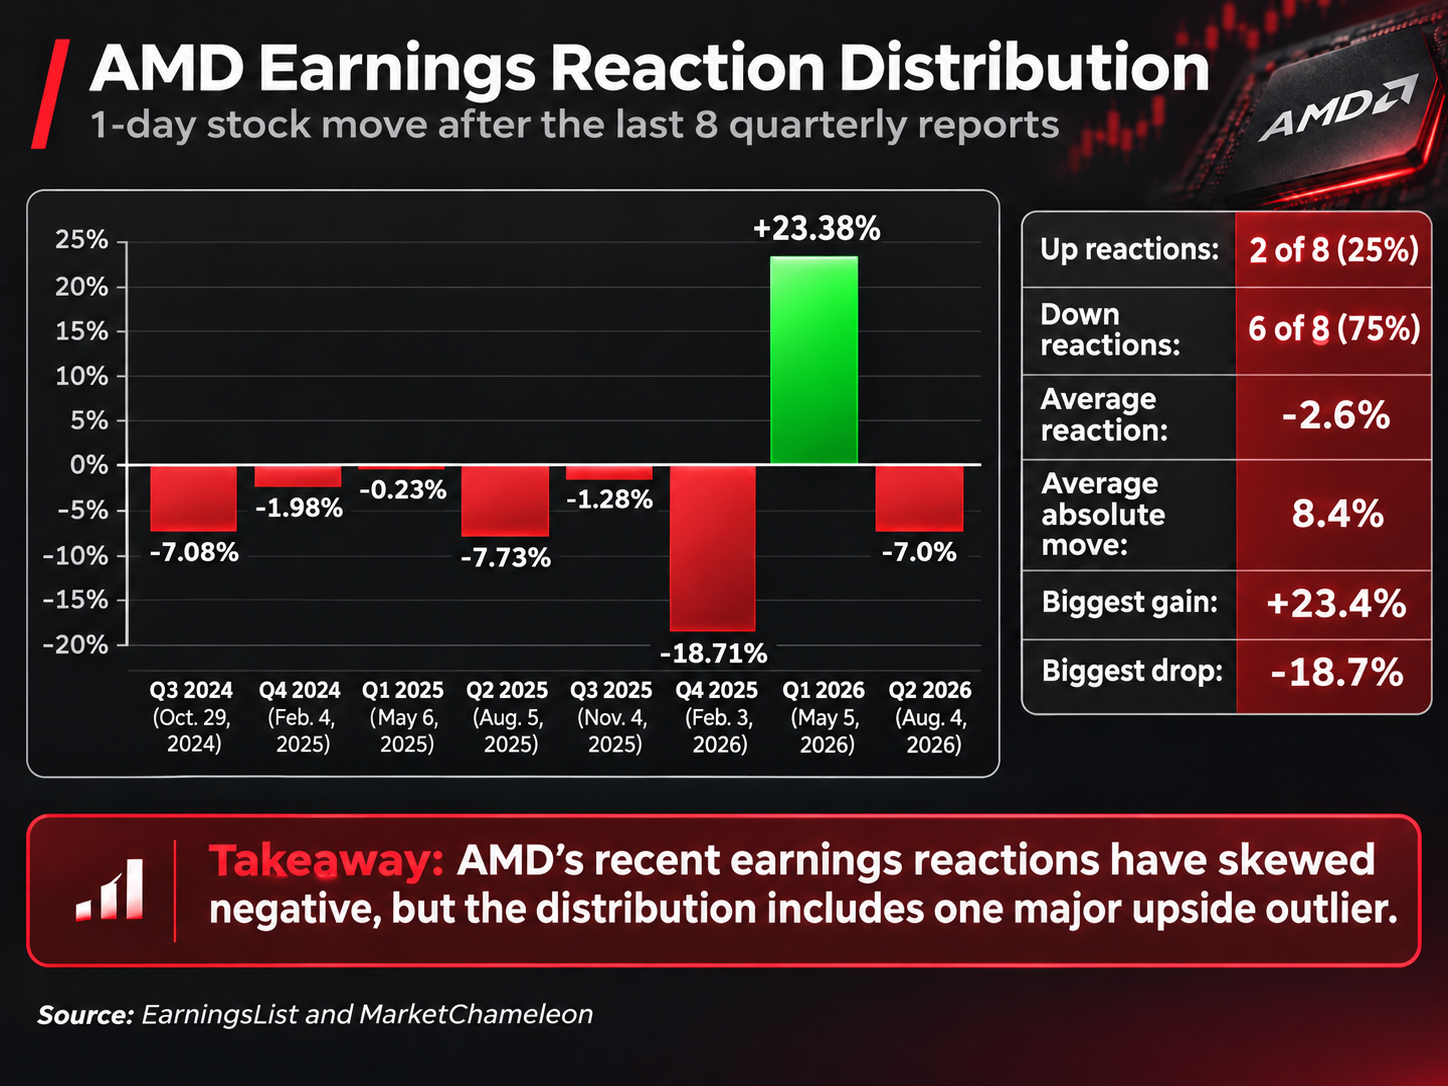
Historical outcomes are widely dispersed: AMD gained 23.4% after May 2026 earnings but lost 18.7% after February’s report. Seven of the last eight immediate reactions were negative, although a sample this small cannot predict the next direction.
The implied one-standard-deviation range is a market-pricing estimate, not a directional forecast or a guarantee of where AMD will trade. It will change as the stock and option premiums move.
Takeaway: Earnings options price a substantial move, but AMD’s history includes outcomes that exceed the implied range. Premium selling requires carefully defined downside risk.
2. Volatility Skew: Elevated Event Premium
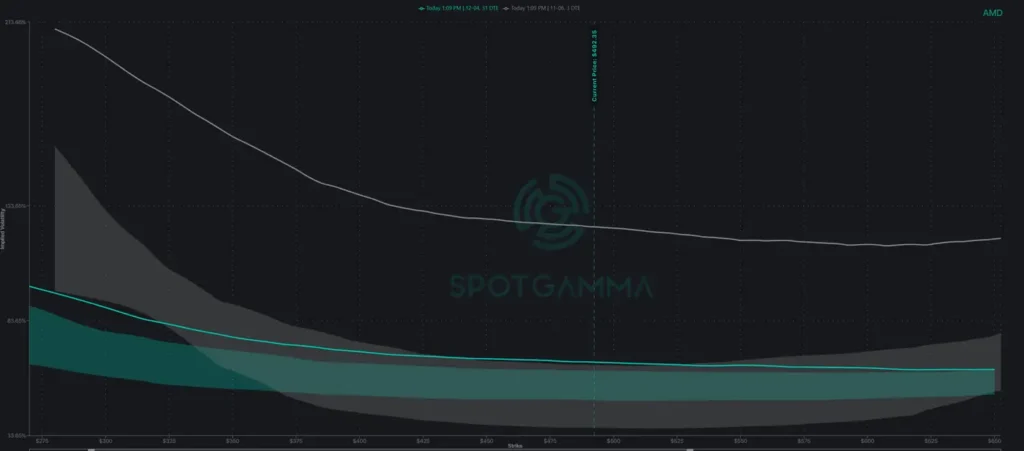
SpotGamma’s skew chart reveals a sharp divide between expirations. Four-day weekly options carry roughly 120–125% near-the-money implied volatility, versus 65–70% for 32-day options. This inversion concentrates substantial event premium in the front week.
Both curves show downside put skew, but weekly IV rises much faster at lower strikes. Traders are paying aggressively for near-term downside protection, while December’s flatter curve implies lower volatility beyond earnings.
The key opportunity is relative volatility compression: the weekly options may lose premium faster after the announcement than longer-dated contracts. However, both expirations can reprice lower, and a large stock gap can overwhelm that advantage. The calendar’s entry debit matters as much as the gap between the two quoted IVs.
Takeaway: The term-structure gap favors evaluating calendars and other defined-risk spreads rather than treating expensive weekly puts as automatically attractive shorts.
3. Dealer Gamma: $440 Support and $510 Upside Test
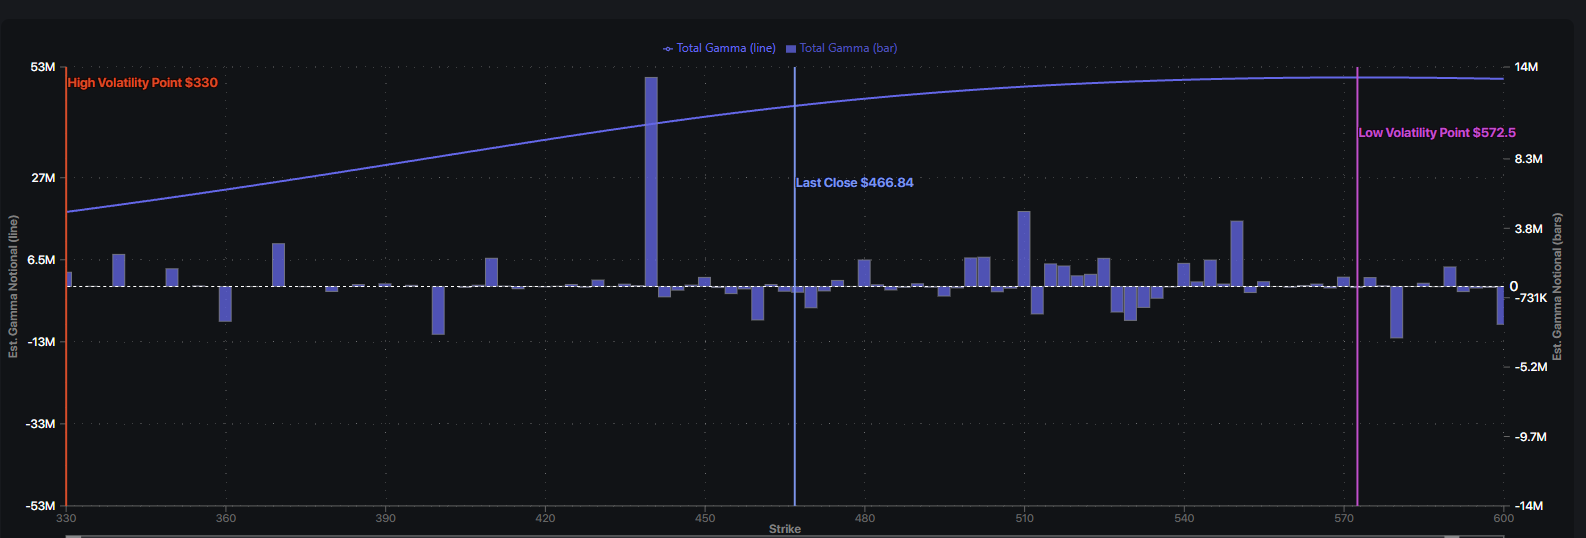
AMD’s refreshed SpotGamma map shows positive aggregate gamma, which can encourage stabilizing dealer hedging during ordinary trading. Earnings gaps, however, can overwhelm those flows.
Key levels include:
- $440: Largest positive-gamma concentration; potential downside stabilization area.
- $460–480: Mixed exposure with less consistent hedging support.
- $510: Meaningful positive gamma and an important upside test.
- $550–572.50: Additional gamma concentration near $550 and SpotGamma’s $572.50 low-volatility point.
These levels describe positioning, not guaranteed floors or ceilings. If AMD moves beyond the implied range, dealers’ hedging profile may change rapidly.
Takeaway: Watch $440 on a selloff and $510 on a rally, especially as positions reset after earnings.
4. Fundamental Catalysts: Guidance Is the Main Event
Consensus calls for approximately $13.1 billion in revenue and $1.95 adjusted EPS. Management previously guided to about $13.0 billion in sales and a 56% non-GAAP gross margin.
Investors will focus on four questions:
- AI accelerators: Is MI450/Helios deployment progressing toward meaningful 2027 revenue?
- EPYC CPUs: Can server share gains continue to support data center growth?
- Major customers: Are large AI infrastructure commitments converting into shipments and revenue?
- Forward guidance: Can management support fourth-quarter revenue expectations near $16.2-$16.3 billion and confidence in next year’s ramp?
Given the stock’s high expectations, an earnings beat without convincing guidance may not sustain a rally. Any slippage in AI deployment timing or pressure on margins could outweigh otherwise solid quarterly results.
5. Three Post-Earnings Scenarios
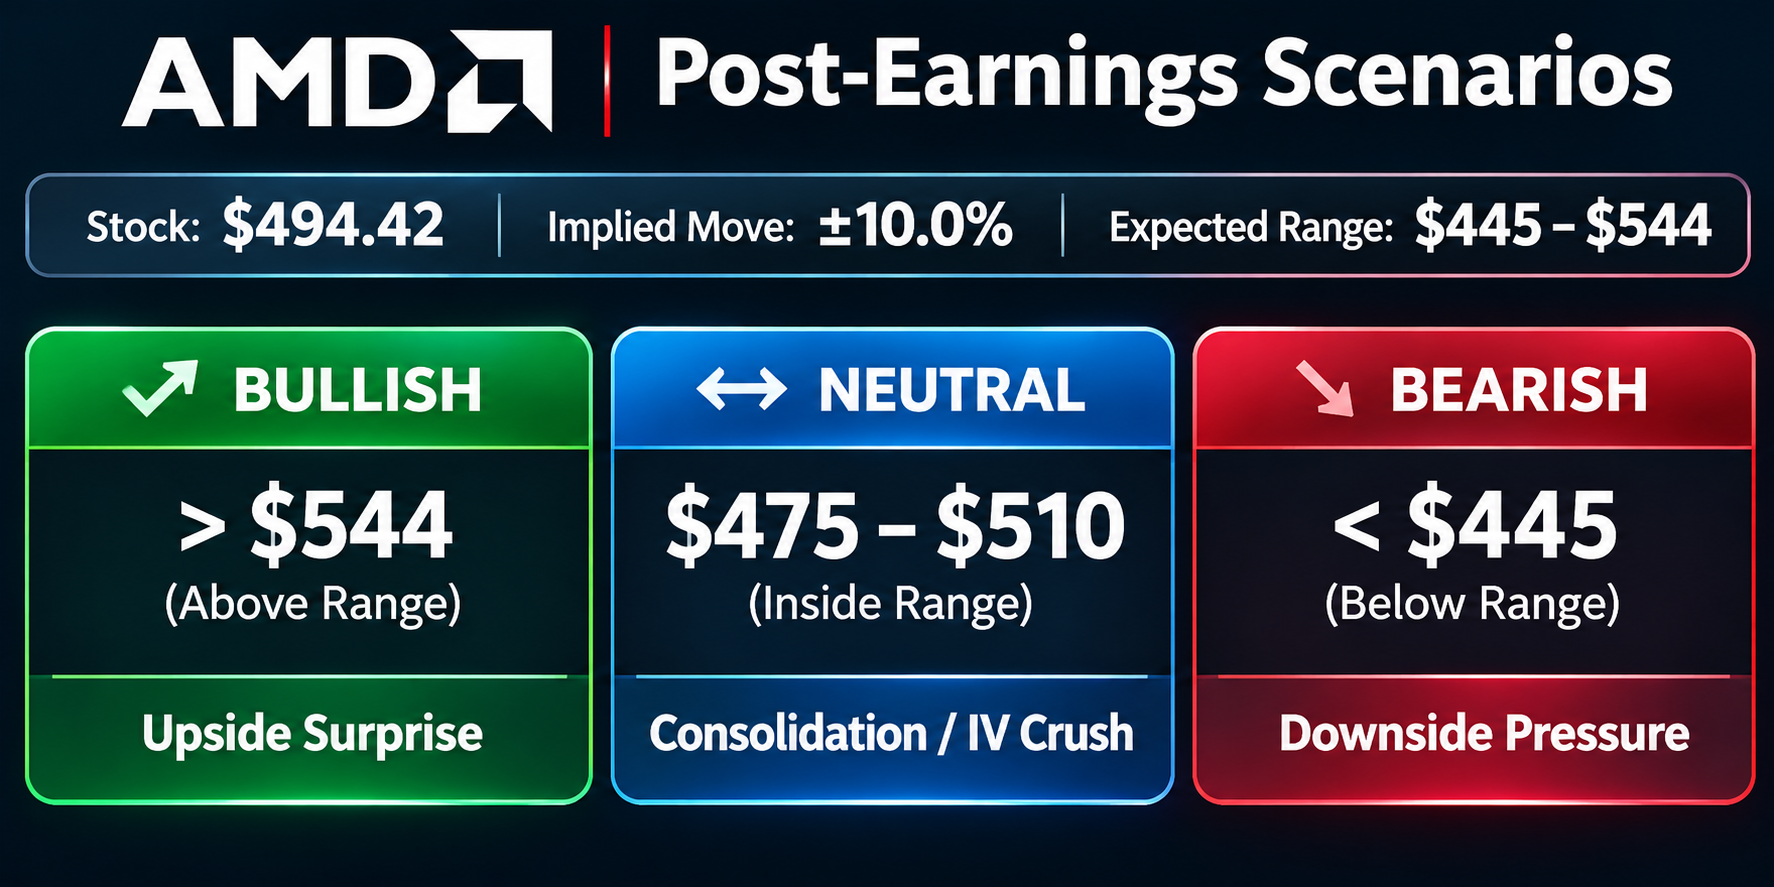
At $494, AMD’s approximately ±10% implied range spans $445-$544.
- Bullish — above $544: Upside surprise, potentially following a move through $510 gamma concentration.
- Neutral — $475-$510: A contained reaction could favor volatility compression and the proposed put calendar.
- Bearish — below $445: Selling would test the nearby $440 positive-gamma concentration; a failure there could increase downside momentum.
These are reference zones, not forecasts; the chart illustrates simplified outcomes rather than every possible price path.
6. Options Trade Idea: $475 Put Calendar Spread
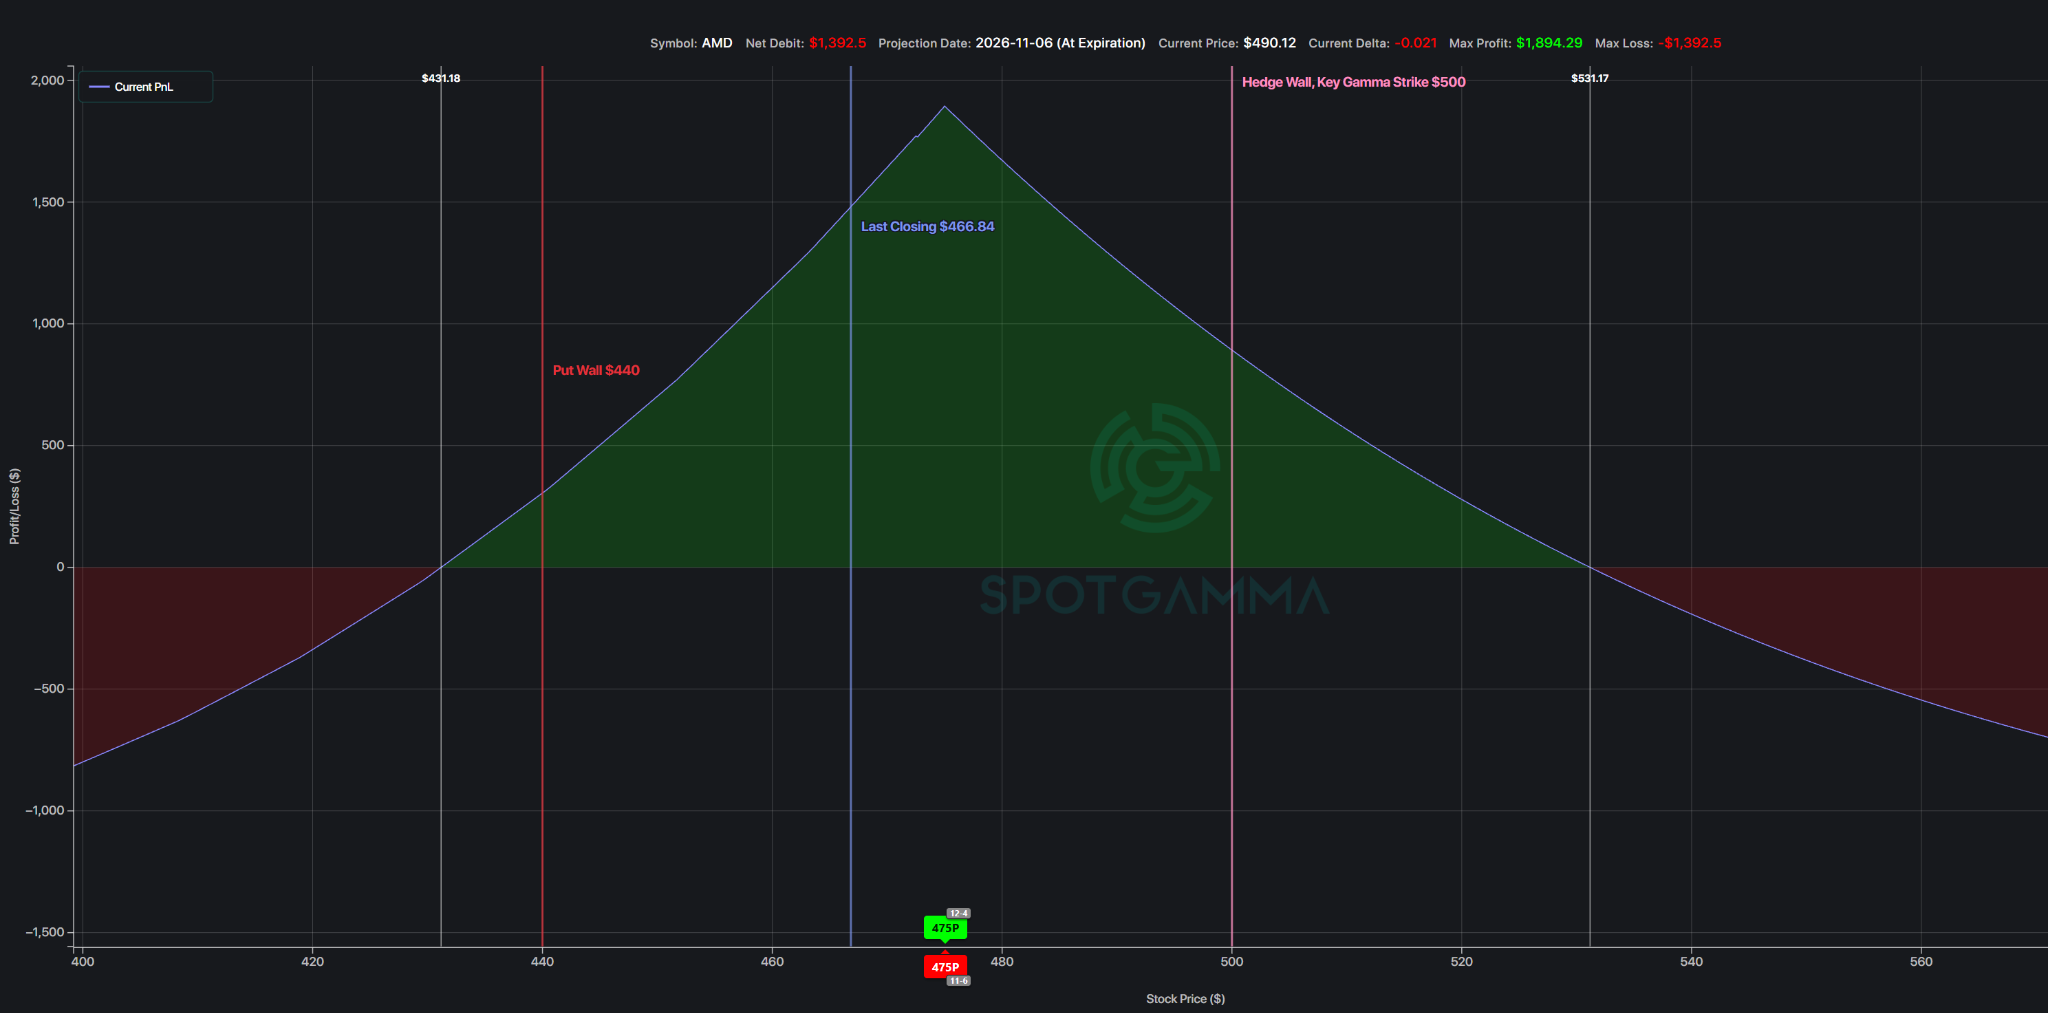
AMD’s steep IV term structure supports considering a $475 put calendar as a defined-risk, moderately bearish earnings trade.
Illustrative structure: Sell the November 6 $475 put and buy the December 4 $475 put for an indicative $13.75 net debit ($1,375 per spread), subject to live execution prices as of Tuesday midday.
The ideal outcome is a controlled decline toward $475, about 4% below the $494 reference, followed by faster premium decay in the expiring weekly put than in the December put. Unlike a put credit spread, this position does not require AMD to remain above a distant downside strike; it benefits most from finishing near the shared strike as the short leg approaches expiration.
Primary risks: A large move in either direction, sharp December IV compression, and early assignment of the short put. The initial debit is generally the maximum theoretical loss if the spread is managed appropriately; reassess promptly after earnings rather than holding the short option unattended through expiration.
Takeaway: The calendar targets a contained, slightly bearish reaction and a favorable front-versus-back volatility repricing—not simply an IV crush in isolation.
Final Thoughts
AMD enters earnings with expensive short-term volatility, downside hedging demand, and positive aggregate gamma. The decisive catalyst is likely forward AI guidance rather than the reported quarter alone. Traders should focus on what options already price, where dealer positioning may matter, and whether their chosen spread remains attractive after volatility adjusts.